Chapter 9 Analyze the Comparative C
T
Experiment
View the Gene Expression Plot and Well Table
163
Applied Biosystems 7500/7500 Fast Real-Time PCR System Getting Started Guide for Relative Standard Curve
and Comparative C
T
Experiments
Notes
View the Plot and
Well Table
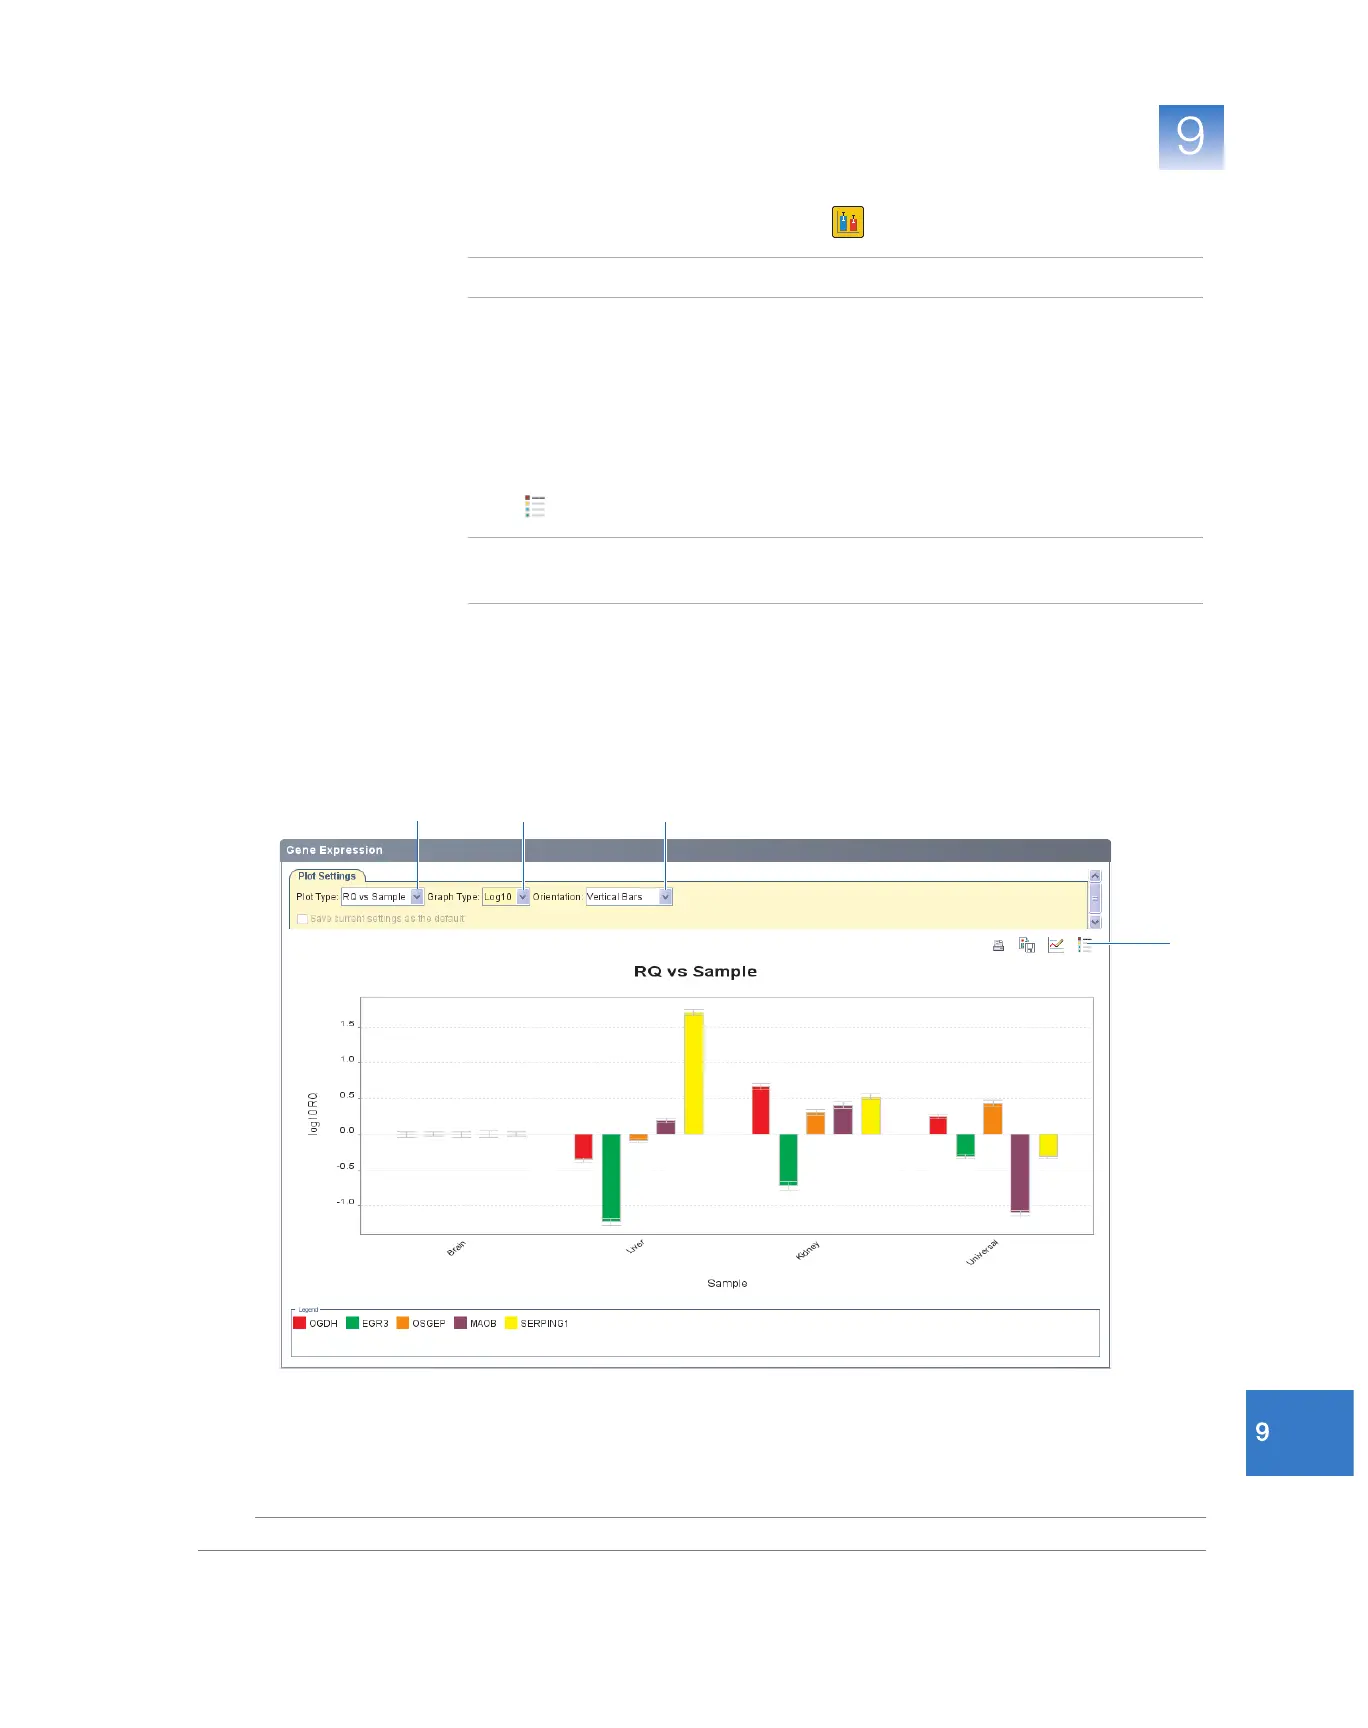
1. In the navigation pane, select Analysis Gene Expression.
Note: If no data are displayed, click Analyze.
2. In the Gene Expression Plot screen:
a. In the Plot Type drop-down list, select RQ vs Sample.
b. In the Graph Type drop-down list, select Log10.
c. In the Orientation drop-down list, select Ve r t i c al B a r s .
3. Click (Show a legend for the plot).
Note: This is a toggle button. When the legend is displayed, the button changes to
Hide the plot legend.
In the example experiment, the expression of EGR3, MAOB, OGDH, OSGEP, and
SERPING1 in the liver, kidney, and universal samples are displayed relative to the
expression in the reference sample (brain). Because the reference sample is
compared to itself, the relative expression level is 1. When the result is displayed in
the Log10 graph type, the expression level of the reference sample appears as 0 in
the graph (log10 of 1 = 0).
2a
2b 2c
3c
 Loading...