Chapter 5 Analyze the Relative Standard Curve Experiment
View the Amplification Plot
91
Applied Biosystems 7500/7500 Fast Real-Time PCR System Getting Started Guide for Relative Standard Curve
and Comparative C
T
Experiments
Notes
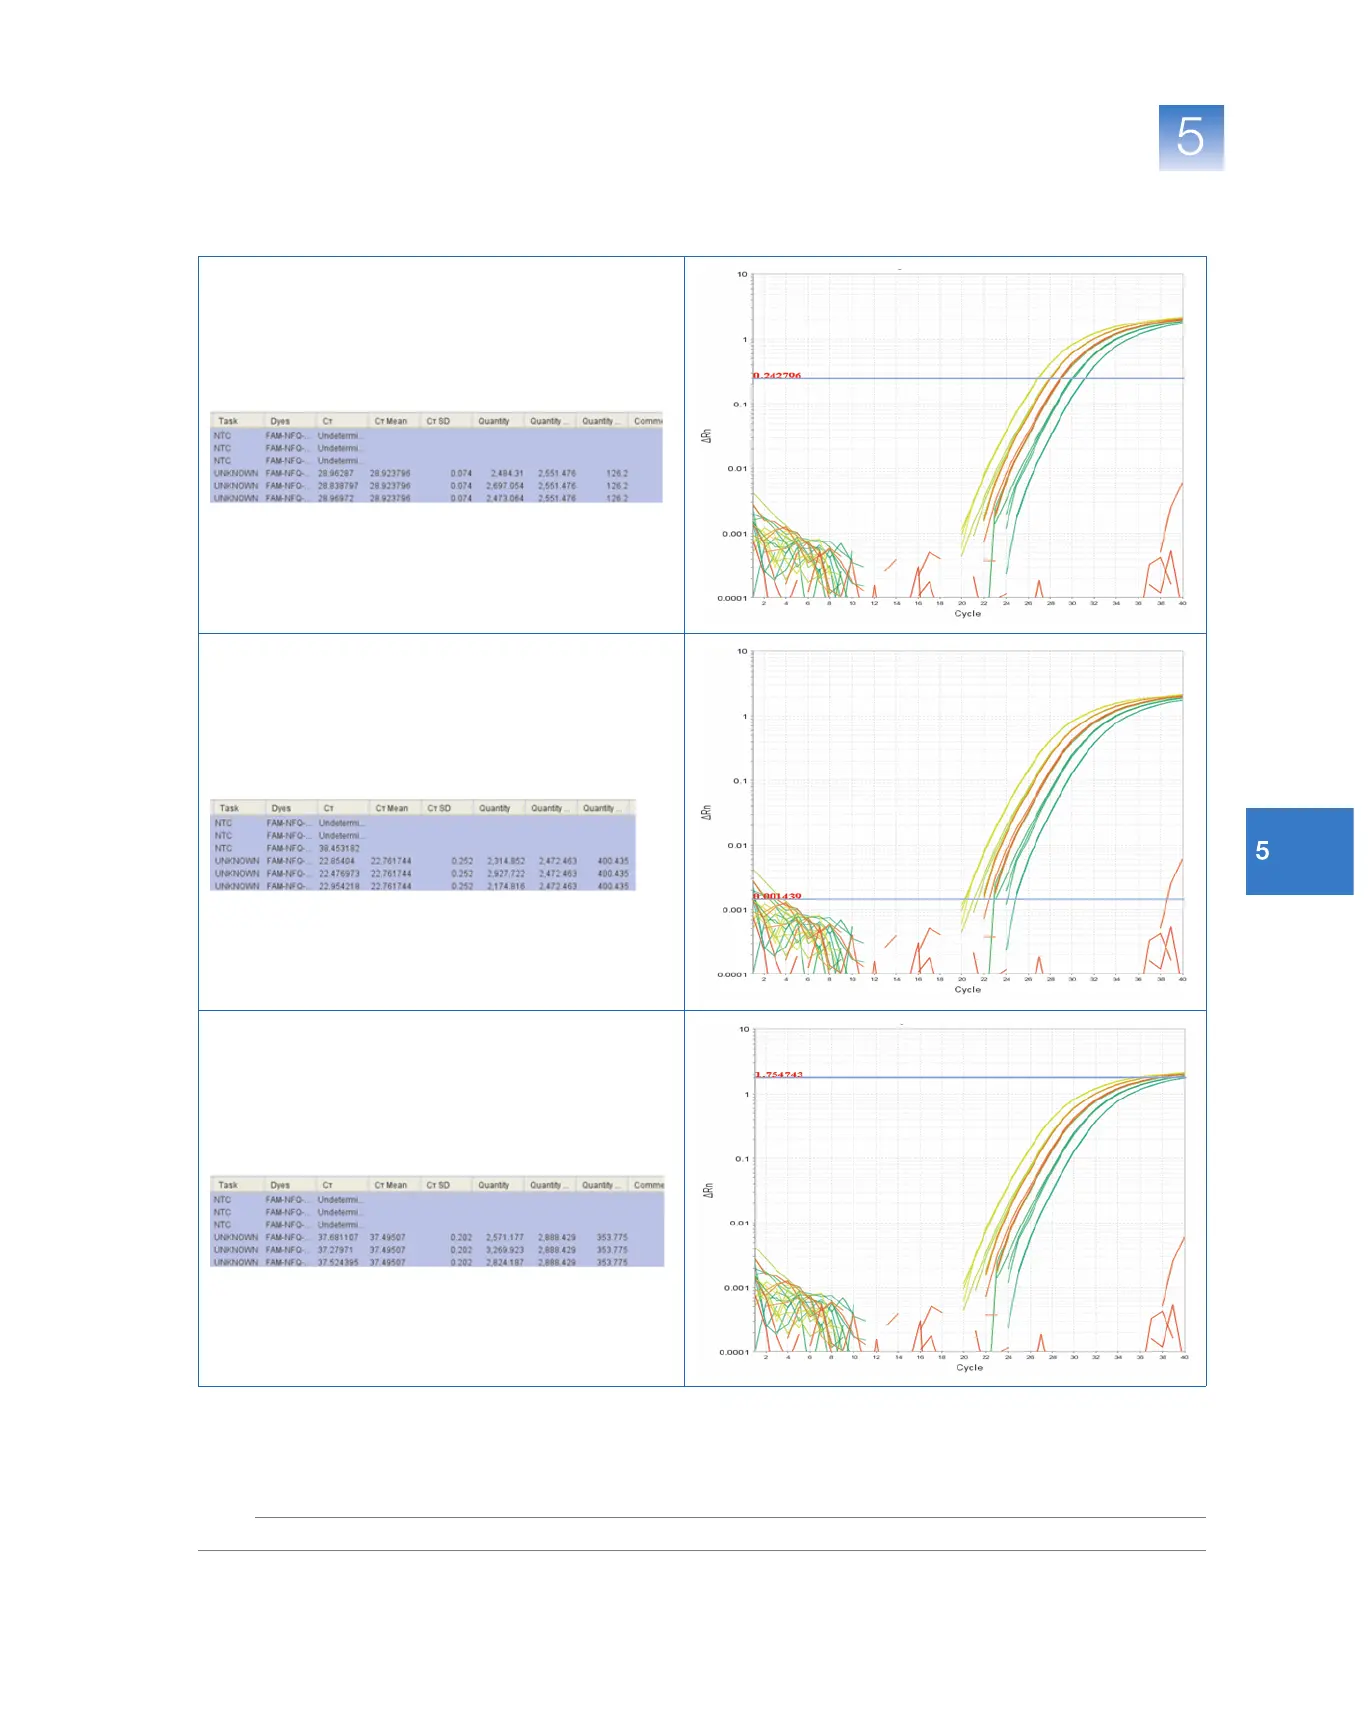
Threshold Examples
Threshold Set Correctly
The threshold is set in the exponential phase of the
amplification curve.
Threshold settings above or below the optimum increase
the standard deviation of the replicate groups.
Threshold Set Too Low
The threshold is set below the exponential phase of the
amplification curve. The standard deviation is significantly
higher than that for a plot where the threshold is set
correctly. Drag the threshold bar up into the exponential
phase of the curve.
Threshold Set Too High
The threshold is set above the exponential phase of the
amplification curve. The standard deviation is significantly
higher than that for a plot where the threshold is set
correctly. Drag the threshold bar down into the
exponential phase of the curve.