Chapter 9 Analyze the Comparative C
T
Experiment
View the Amplification Plot
Applied Biosystems 7500/7500 Fast Real-Time PCR System Getting Started Guide for Relative Standard Curve
and Comparative C
T
Experiments
170
Notes
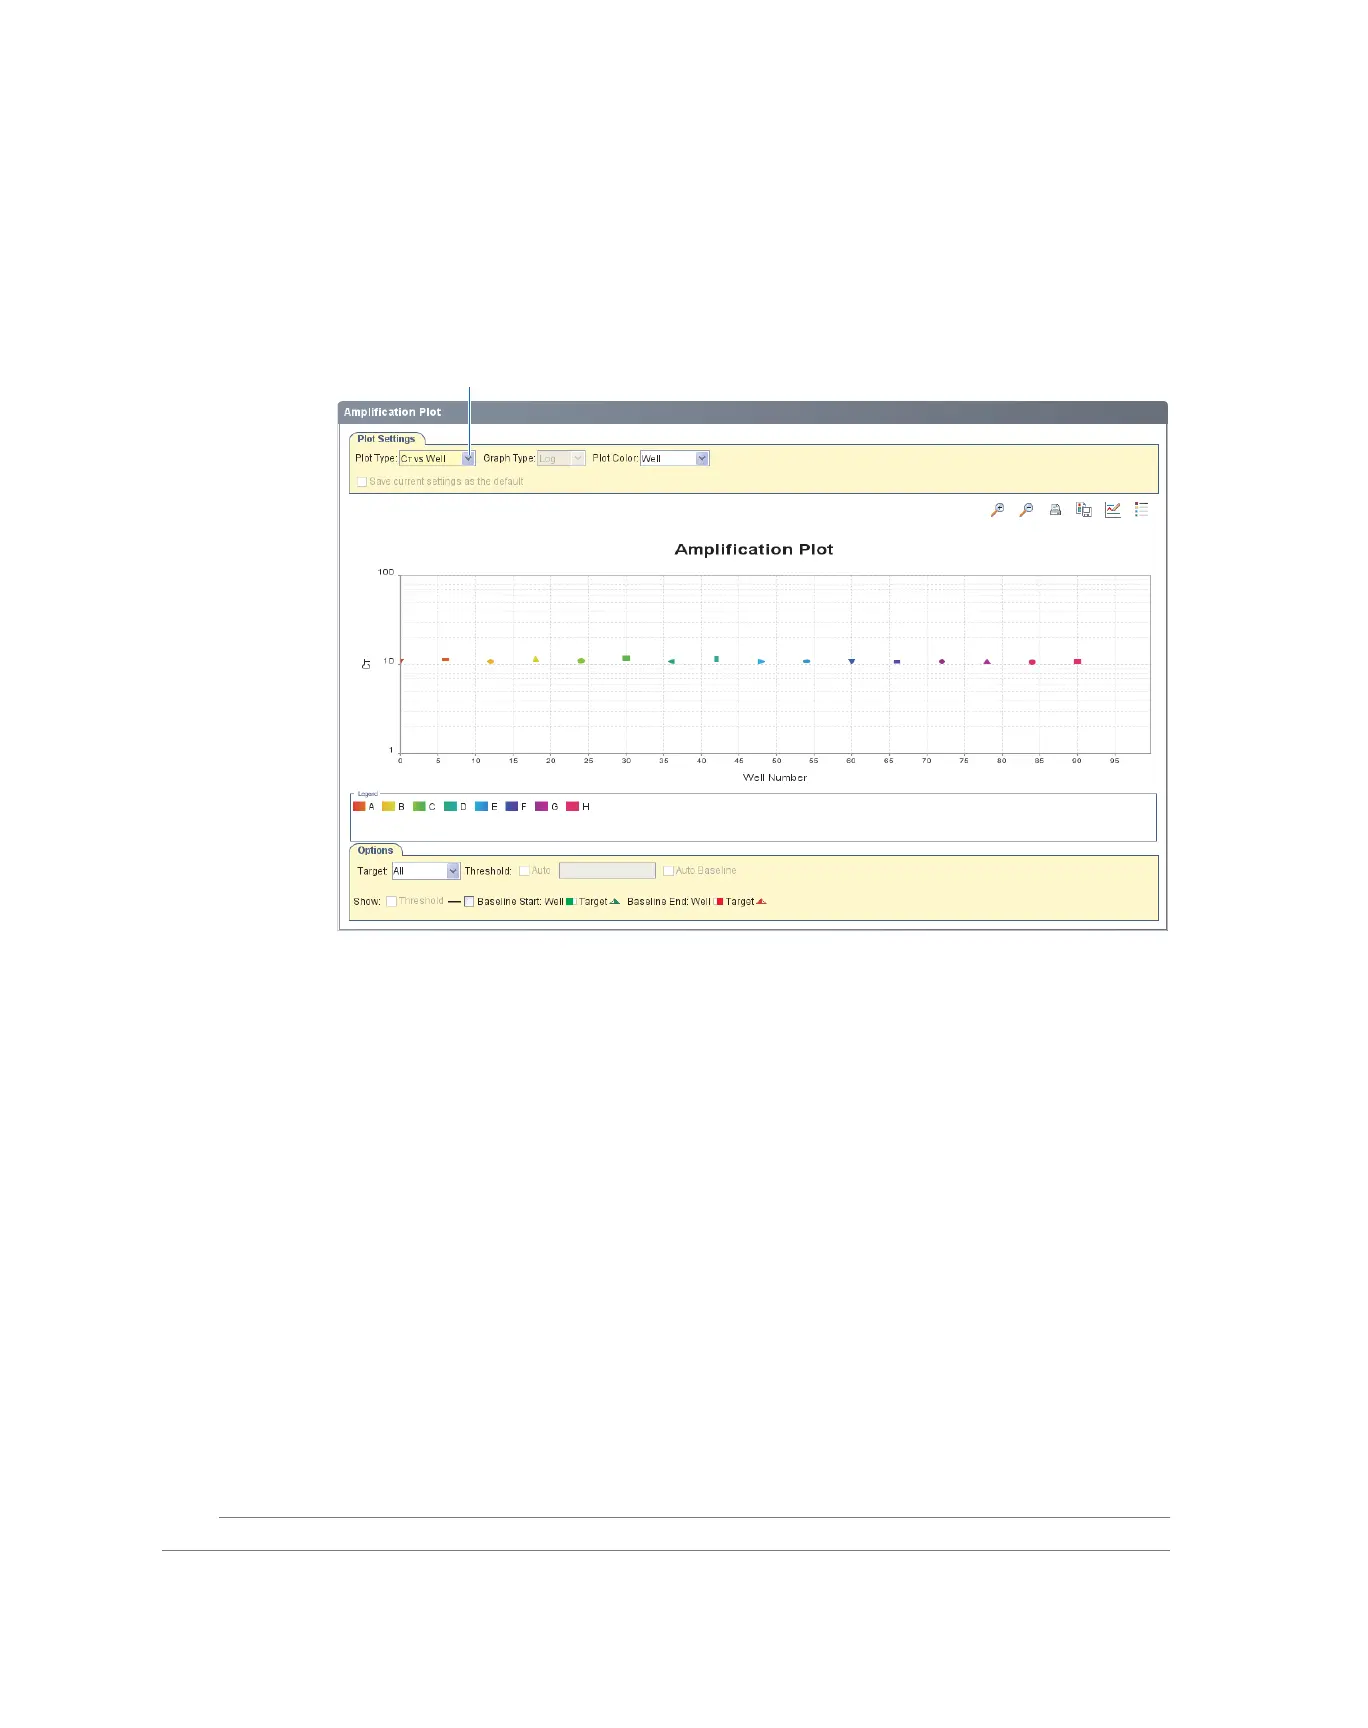
6. Locate any outliers:
a. In Plot Settings tab, select C
T
vs Well in the Plot Type drop-down list.
b. Look for outliers in the amplification plot. In the example experiment, there are
no outliers for 18S.
7. Repeat steps 2 through 6 for the EGR3, MAOB, OGDH, OSGEP, and SERPING1
wells. In the example experiment, there are no outliers for any of the targets.
6a