Chapter 9 Analyze the Comparative C
T
Experiment
Analyze the Study
Applied Biosystems 7500/7500 Fast Real-Time PCR System Getting Started Guide for Relative Standard Curve
and Comparative C
T
Experiments
196
Notes
View the Gene Expression Plot, Replicate Results Table, and Well Table
The Gene Expression Plot screen displays the results of the relative quantitation
calculations in the gene expression profile. Two plots are available:
• RQ vs Target – Groups the relative quantitation (RQ) values by target. Each sample
is plotted for each target. You can view the plot as a linear, log10, Ln, or log2 graph.
• RQ vs BioGroup – Groups the relative quantitation (RQ) values by biological
replicate group (if present). Each target is plotted for each biological group.You can
view the plot as a linear, log10, Ln, or log2 graph.
The Replicate Results Data group organizes the results of the gene expression study by
biological or technical replicate association. The data are organized into two tabs:
Note: The Omit column of the Replicate Results Data group tabs indicates the omission
status of the members of the associated replicate groups. For example, a check mark (✔)
indicates that all members of a group have been omitted from the analysis. A hyphen (–)
indicates that one or more members of the group have been omitted.
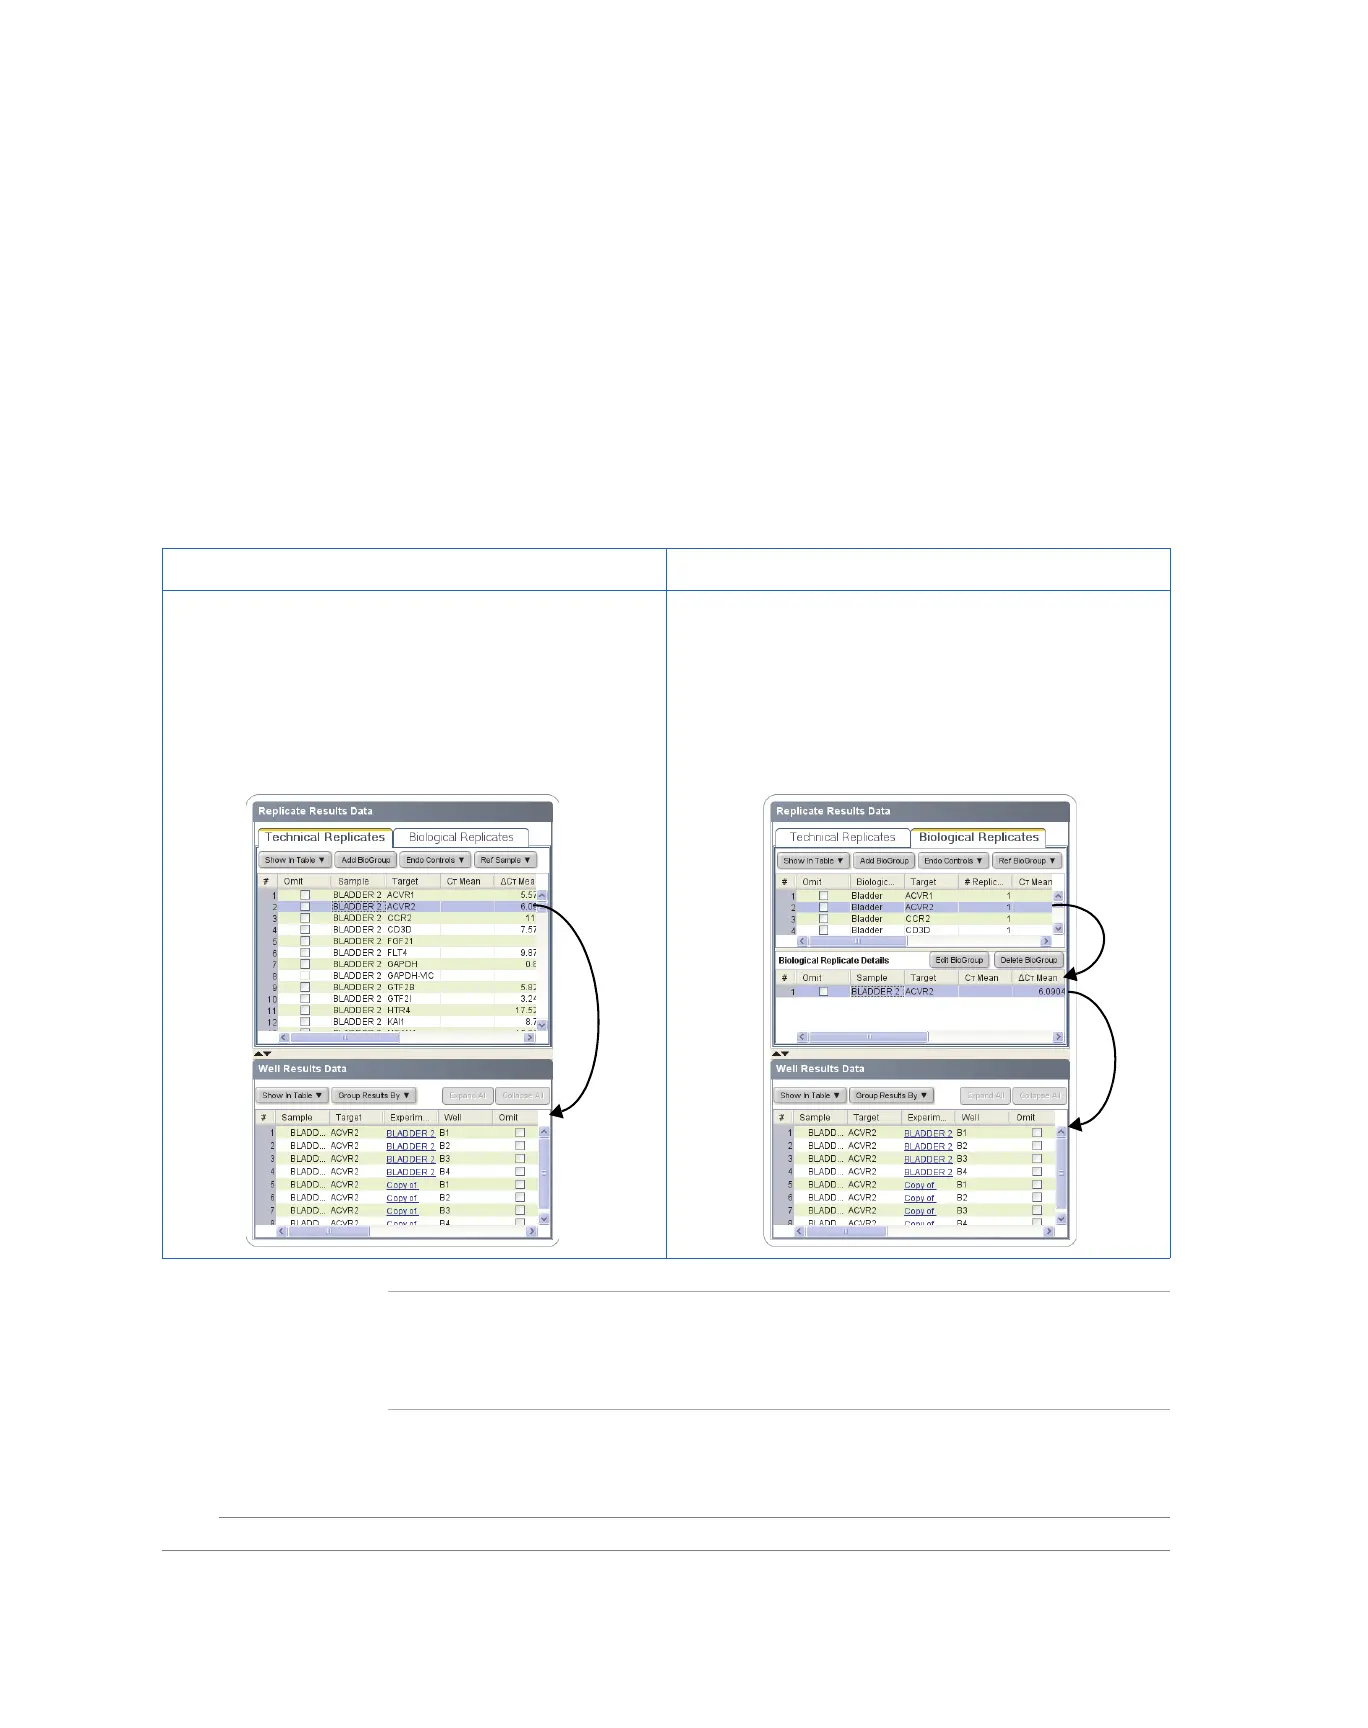
Technical Replicates Tab Biological Replicates Tab
This tab groups the results of the relative quantitation
analysis by technical replicate group. The 7500 software
displays the results for each sample/target combination as a
row in the table. You can view the members of a technical
replicate group by selecting the appropriate row in the table.
When a row is selected, the Well Result Data table displays
the wells that make up the group.
This tab groups the results of the relative quantitation
analysis by biological replicate group. The 7500 software
displays the results for each biological group as a row in the
table. You can view the members of a group by selecting the
appropriate row from the table. When a row is selected, the
Biological Replicate Details table displays the technical
replicates that make up the biological group. You can then
display the members of a technical replicate group by
selecting a row in the Biological Replicate Details table.