Chapter 2 Design the Relative Standard Curve Experiment
Set Up the Standards
Applied Biosystems 7500/7500 Fast Real-Time PCR System Getting Started Guide for Relative Standard Curve
and Comparative C
T
Experiments
30
Notes
Design
Guidelines
When you design your own relative standard curve experiment:
• Set up a standard curve for each target in the reaction plate. The targets are
previously defined in the Targets screen (“Set Up the Targets” on page 26).
• Enter the number of points for each standard curve in the reaction plate. Applied
Biosystems recommends at least five dilution points for each standard curve.
• Enter the number of identical reactions (replicates) for each point in the standard
curve. Applied Biosystems recommends three replicates for each point.
• Because the range of standard quantities affects the amplification efficiency
calculations, carefully consider the appropriate range of standard quantities for your
assay:
– For more accurate measurements of amplification efficiency, use a broad range of
standard quantities, such as between 10
5
and 10
6
. If you specify a broad range of
quantities for the standards, you need to use a PCR product or a highly
concentrated template, such as a cDNA clone.
– If you have a limited amount of cDNA template and/or if the target is a low-copy
number transcript, or known to occur within a specified range, a narrow range of
standard quantities may be necessary.
• The serial factor is used to calculate the quantities in all points of the standard curve.
If your starting quantity is the highest quantity, select a serial factor such as 1:2, 1:3,
and so on. If your starting quantity is the lowest quantity, select a concentration
factor such as 2✕, 3✕, and so on.
1
2
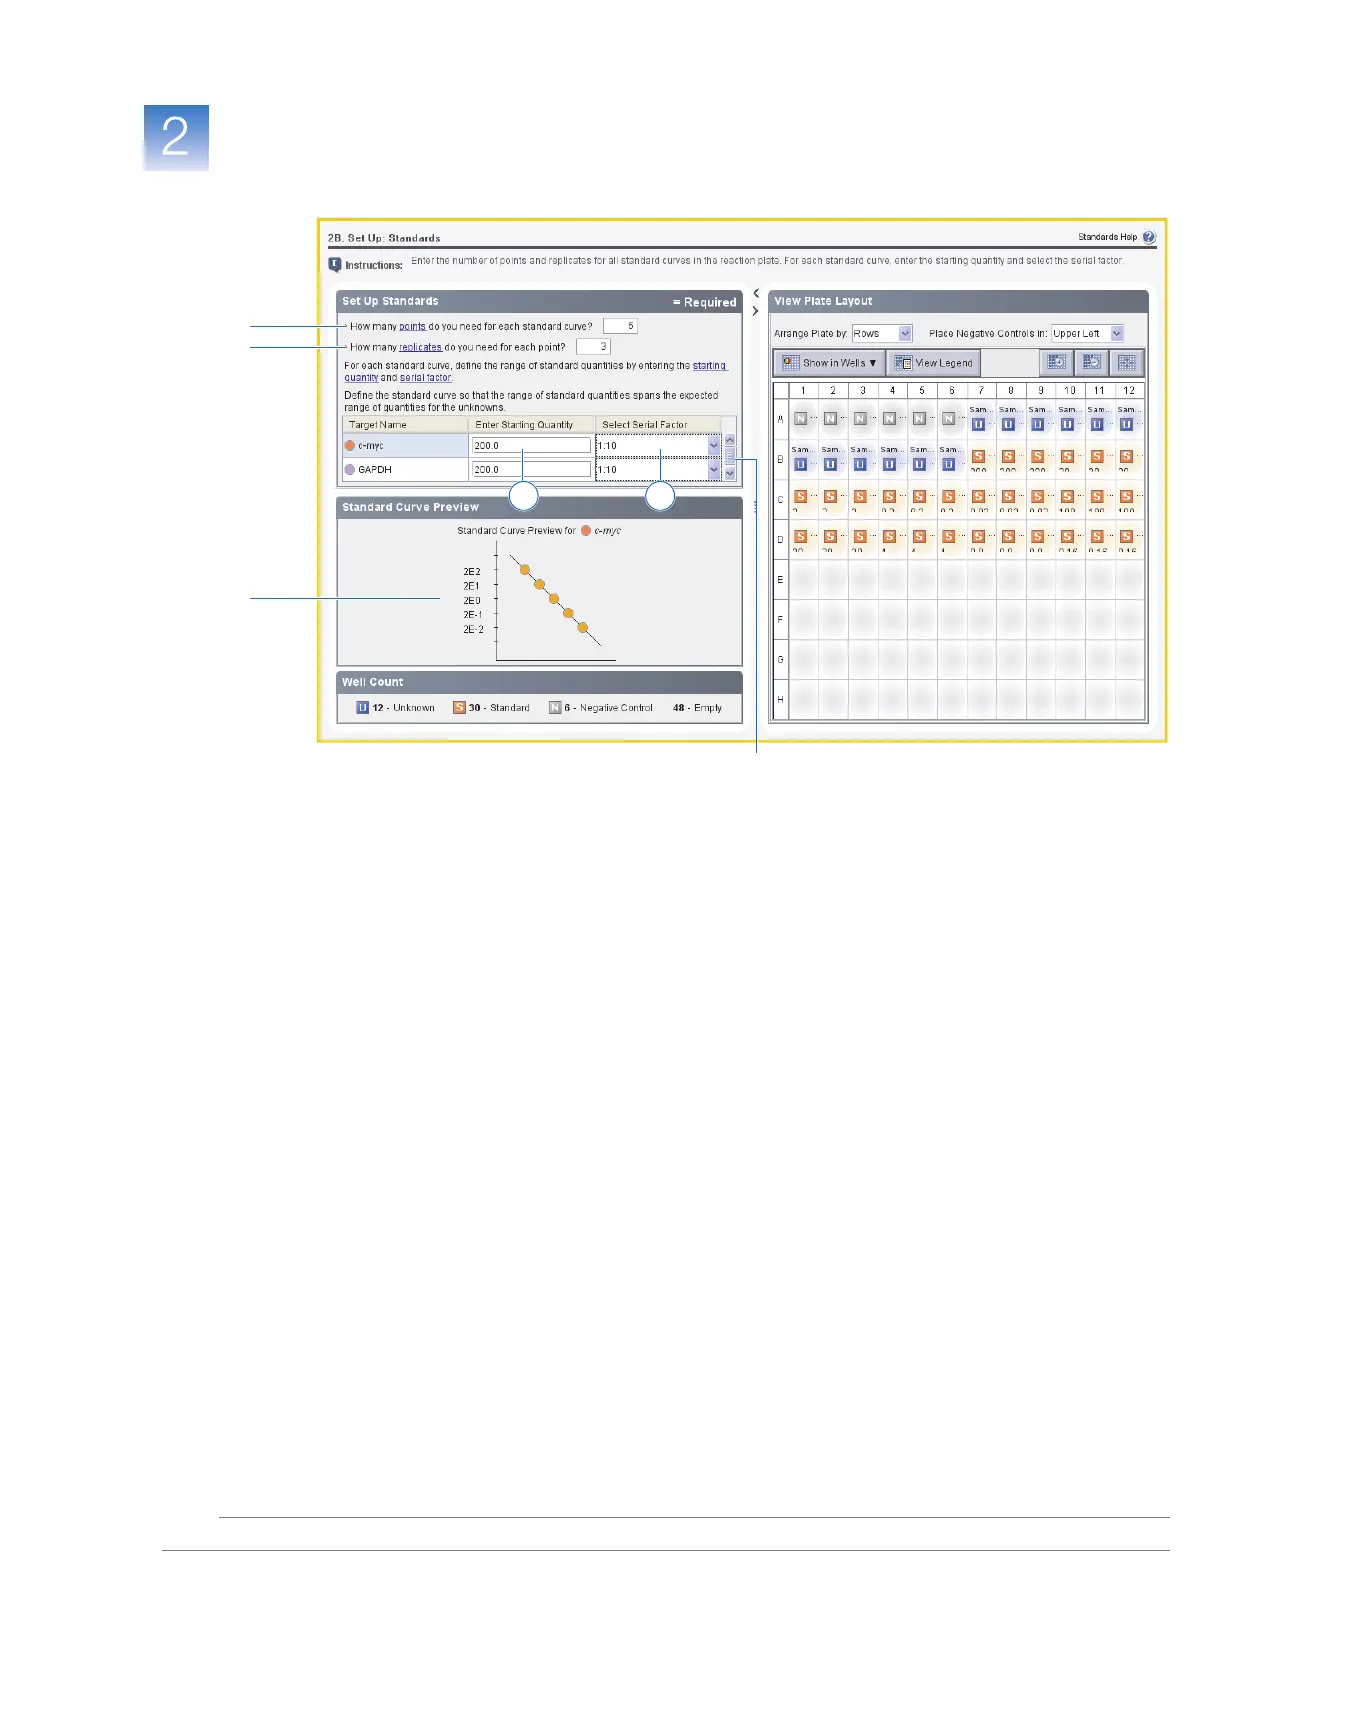
5
If needed, use the scroll bar to view GAPDH,
then perform steps 4a and 4b.
3b
3a