Chapter 4 Run the Relative Standard Curve Experiment
Monitor the Run
73
Applied Biosystems 7500/7500 Fast Real-Time PCR System Getting Started Guide for Relative Standard Curve
and Comparative C
T
Experiments
Notes
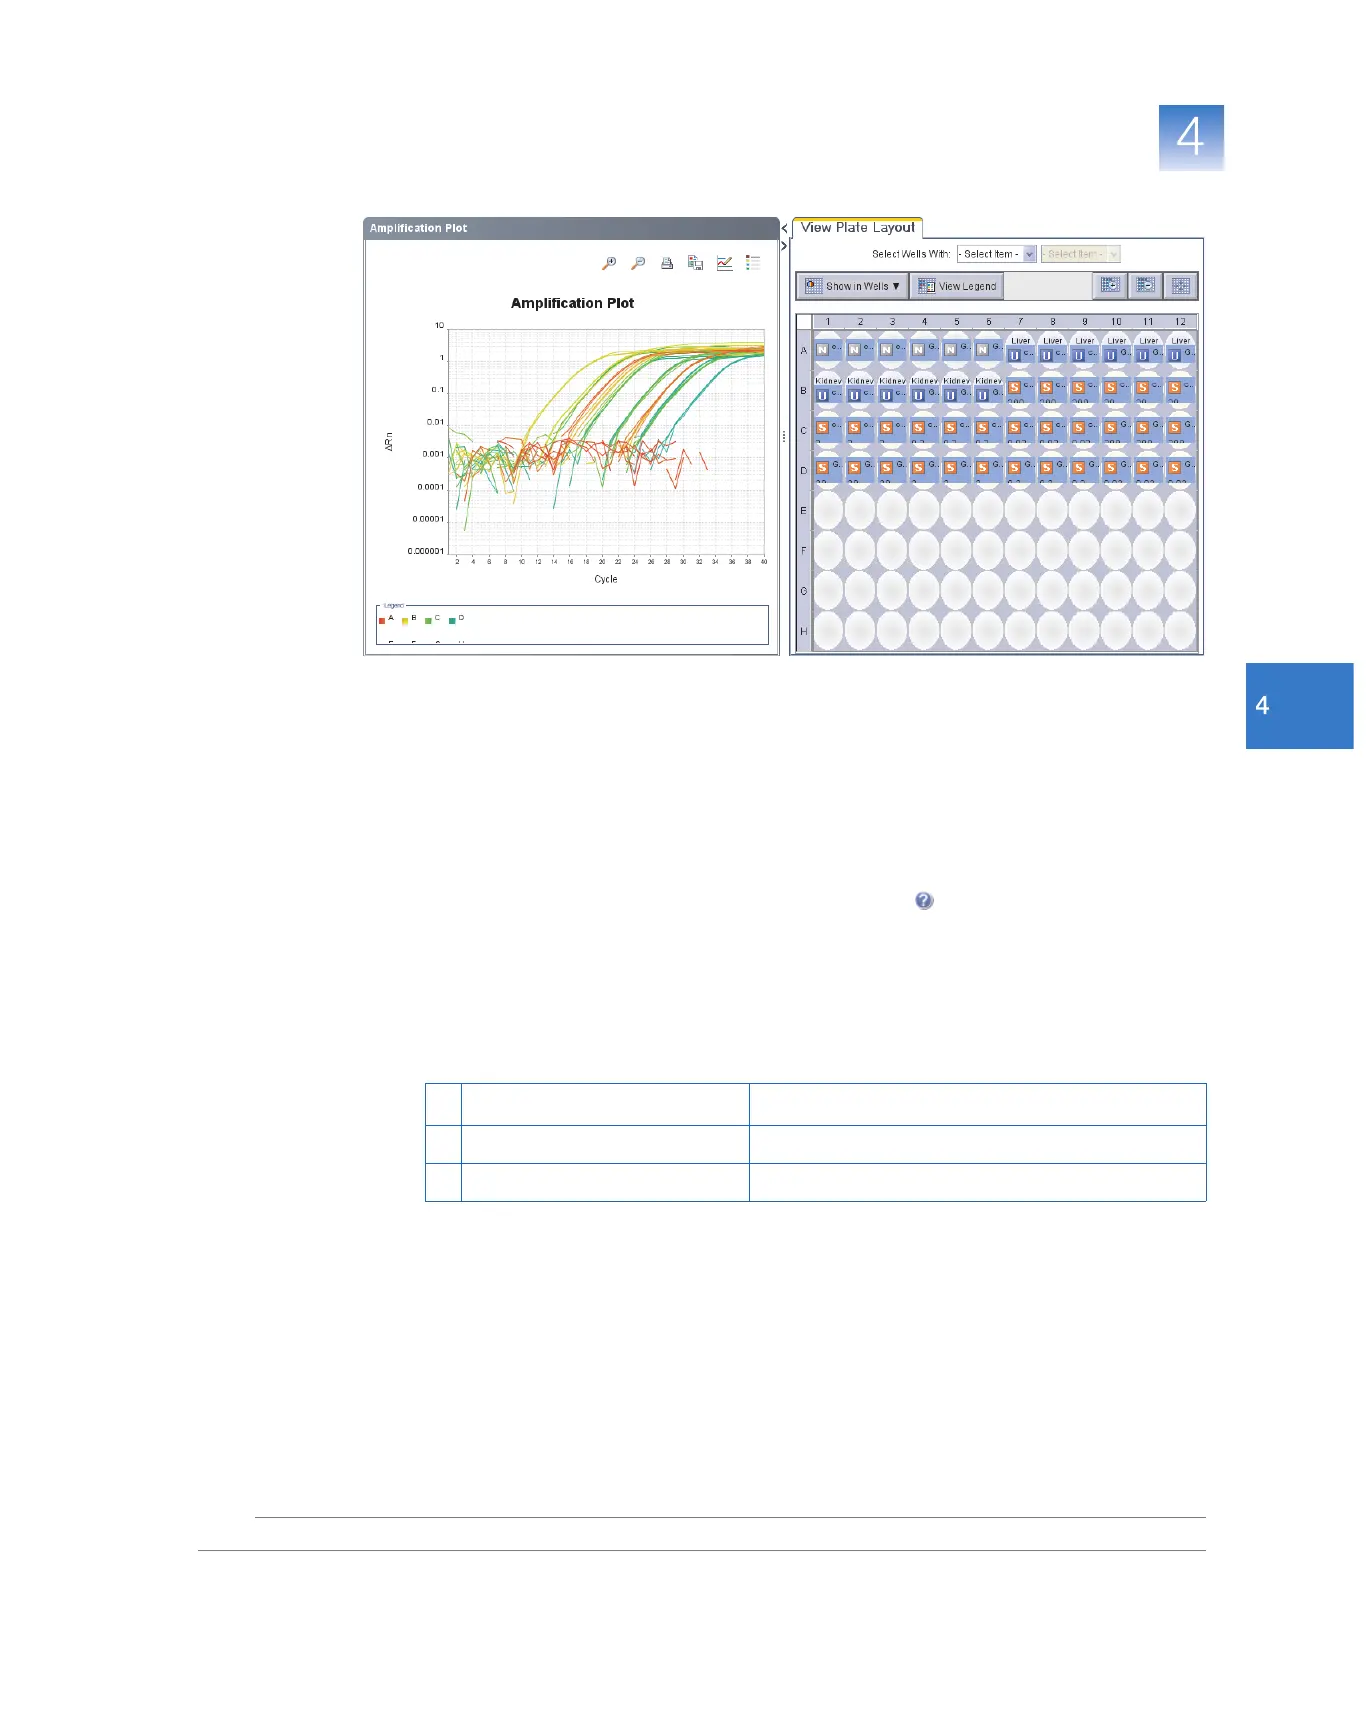
The Amplification Plot screen helps you identify and examine abnormal amplification.
Abnormal amplification can include:
• Increased fluorescence in negative control wells.
• Absence of detectable fluorescence at an expected cycle (determined from previous
similar experiments that were run using the same reagents under the same
conditions).
If you notice abnormal amplification or a complete absence of florescence, troubleshoot
the error as explained in the 7500 Software Help (click or press F1).
About the Run Method Screen
This screen displays the method for the run in progress. The software updates the Run
Status field throughout the run. The figure below shows the Run Method screen as it
appears in the example experiment.
To… A ct i o n
A Change the number of cycles In the Number of Cycles field, enter a number.
B Apply your changes Click Save Run Method.