www.accuenergy.com
V: 1.00 Revised: Jan 2021
32
AcuRev 2100 Series Power Meter: Web Manual
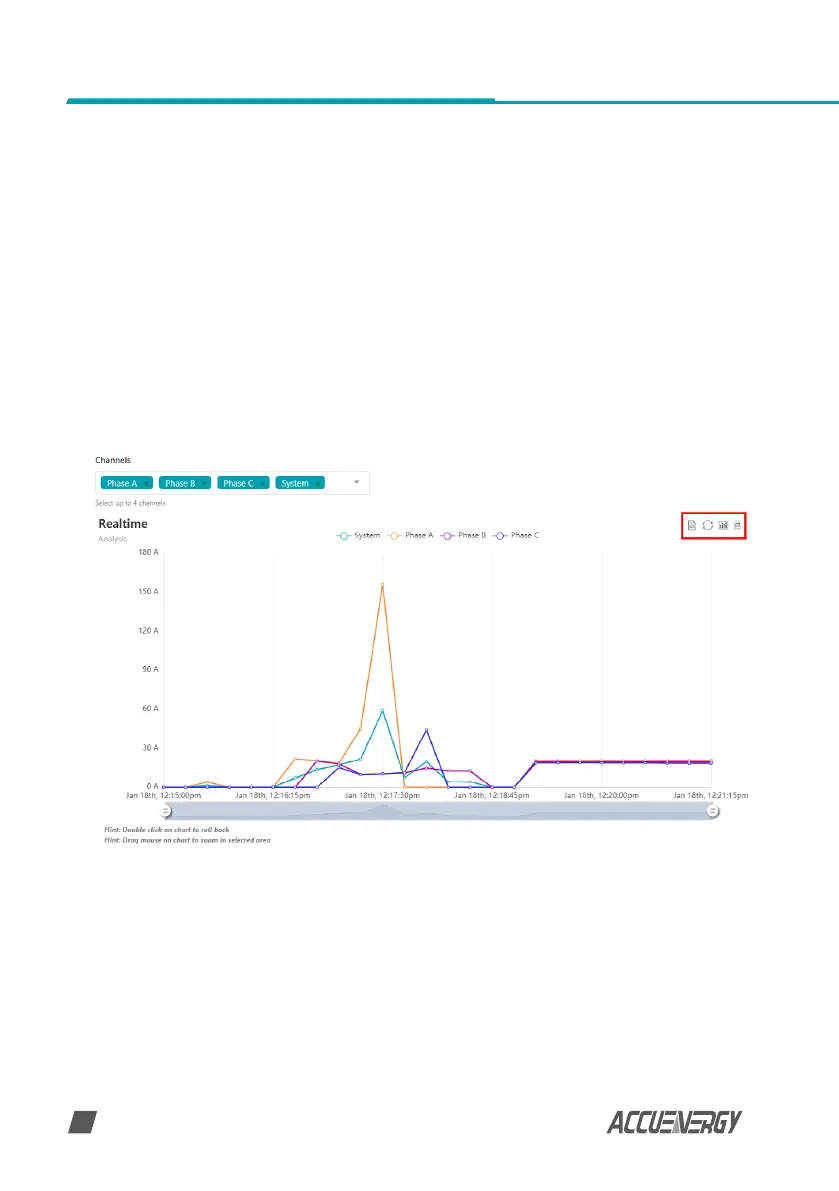
6.4.1 Trend Log
The Trend Log web page includes the real-time and energy trend diagram. The real-time trend
log diagram can be selected to show the following parameters phase voltage, line voltage,
current, active power, reactive power, apparent power and power factor for each phase as well
as the totals. The energy trend log shows the imported and exported active energy, reactive
energy, total energy, net energy and apparent energy.
The data of the trend log can be previewed and downloaded as a .csv le by clicking the 'Data
Review' and 'Data' icons on the right top side of the diagram. The trend log diagram can also
be saved as an image by clicking the 'Image' icon. See the icons outlined (red box) in the
image below.
 Loading...