33
System Description
B
B
Installation
Resistor Plate Verifi cation of RTCA SP Instrument
Lift the lock handle of the RTCA SP Station, so that the two bearings of the clamp plate
fi t into the grooves of the lock handle, then push lock handle downward to horizontal
position. The clamp plate will lock the RTCA Resistor Plate 96 at the horizontal position.
A green LED will light up on the front of the RTCA SP Station to indicate that a device
is engaged.
Make sure that all RTCA Contact Pins 96 and the contact pads of the RTCA Resistor
Plate 96 are clean and free from any dust or dirt particles. If not, use the RTCA Cleaning
Kit to remove any dust.
When inserting the RTCA Resistor Plate 96 into the slot of the Station, make sure
that the Resistor Plate is FULLY inside the pocket and is aligned properly with the
edges of the pocket. It should be fl at and without any tilt.
The Power LED (green) on the front panel of the RTCA SP Station remains on
while it is connected to the switched-on RTCA Analyzer.
Perform the test
Wait until the automatic scan fi nishes, then click Start to begin the test. While the test
is running, notice that the bottom of the program window reads “Test Col 1,2,3, ….12”,
and the status LED and communication LED on the RTCA Analyzer will fl ash during
the measurement.
Check the data
Upon completion of the test, check the Cell Index Page. All of the Cell Index values
should be less than 0.063. Go to the Plot page and click Add All. All CI values will be
displayed for the 96 wells (Figure 20).
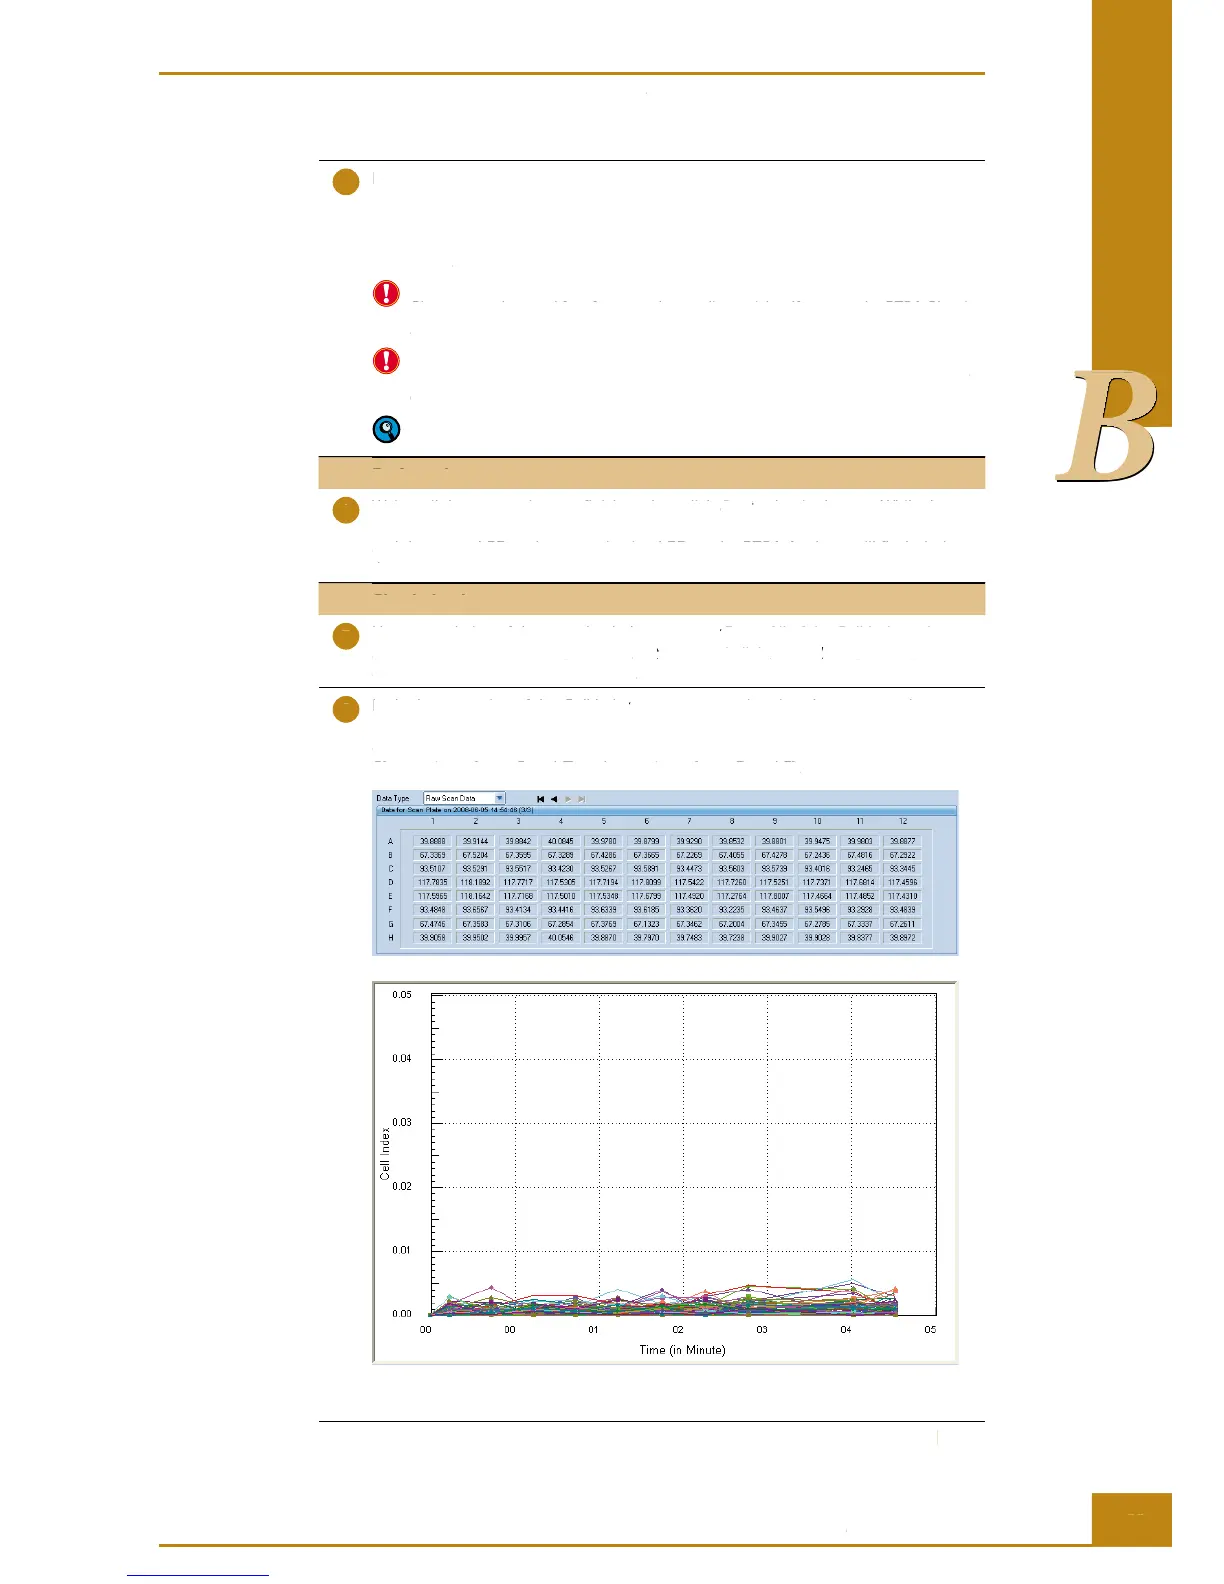
In the lower portion of the Cell Index page, you can also view the raw scan data.
The data has 8 rows by 12 columns as shown in Figure 20. The raw scan data should
exhibit a repeated value pattern of 40.0 ± 2.0 (rows A and H), 67.5 ± 2.5 (rows B and
G), 93.6 ± 2.9 (rows C and F) and 117.6 ± 3.2 (rows D and E).
Figure 20: An example of resistor plate verifi cation calibration raw data and Cell Index curves.
Resistor Plate Verifi cation of RTCA SP Instrument
Lift the lock handle of the RTCA SP Station, so that the two bearings of the clamp plate
fi t into the grooves of the lock handle, then push lock handle downward to horizontal
position. The clamp plate will lock the RTCA Resistor Plate 96 at the horizontal position.
A green LED will light up on the front of the RTCA SP Station to indicate that a device
Make sure that all RTCA Contact Pins 96 and the contact pads of the RTCA Resistor
Plate 96 are clean and free from any dust or dirt particles. If not, use the RTCA Cleaning
When inserting the RTCA Resistor Plate 96 into the slot of the Station, make sure
that the Resistor Plate is FULLY inside the pocket and is aligned properly with the
edges of the pocket. It should be fl at and without any tilt.
The Power LED (green) on the front panel of the RTCA SP Station remains on
while it is connected to the switched-on RTCA Analyzer.
Wait until the automatic scan fi nishes, then click
to begin the test. While the test
Start to begin the test. While the test Start
is running, notice that the bottom of the program window reads “Test Col 1,2,3, ….12”,
and the status LED and communication LED on the RTCA Analyzer will fl ash during
Upon completion of the test, check the
Page. All of the Cell Index values
Cell Index Page. All of the Cell Index values Cell Index
should be less than 0.063. Go to the
Add All. All CI values will be Add All
displayed for the 96 wells (Figure 20).
In the lower portion of the
page, you can also view the raw scan data.
Cell Index page, you can also view the raw scan data. Cell Index
The data has 8 rows by 12 columns as shown in Figure 20. The raw scan data should
exhibit a repeated value pattern of 40.0 ± 2.0 (rows A and H), 67.5 ± 2.5 (rows B and
G), 93.6 ± 2.9 (rows C and F) and 117.6 ± 3.2 (rows D and E).
Figure 20: An example of resistor plate verifi cation calibration raw data and Cell Index curves.