Agilent 1100 Series LC/MSD Trap System Quick Start Guide 13
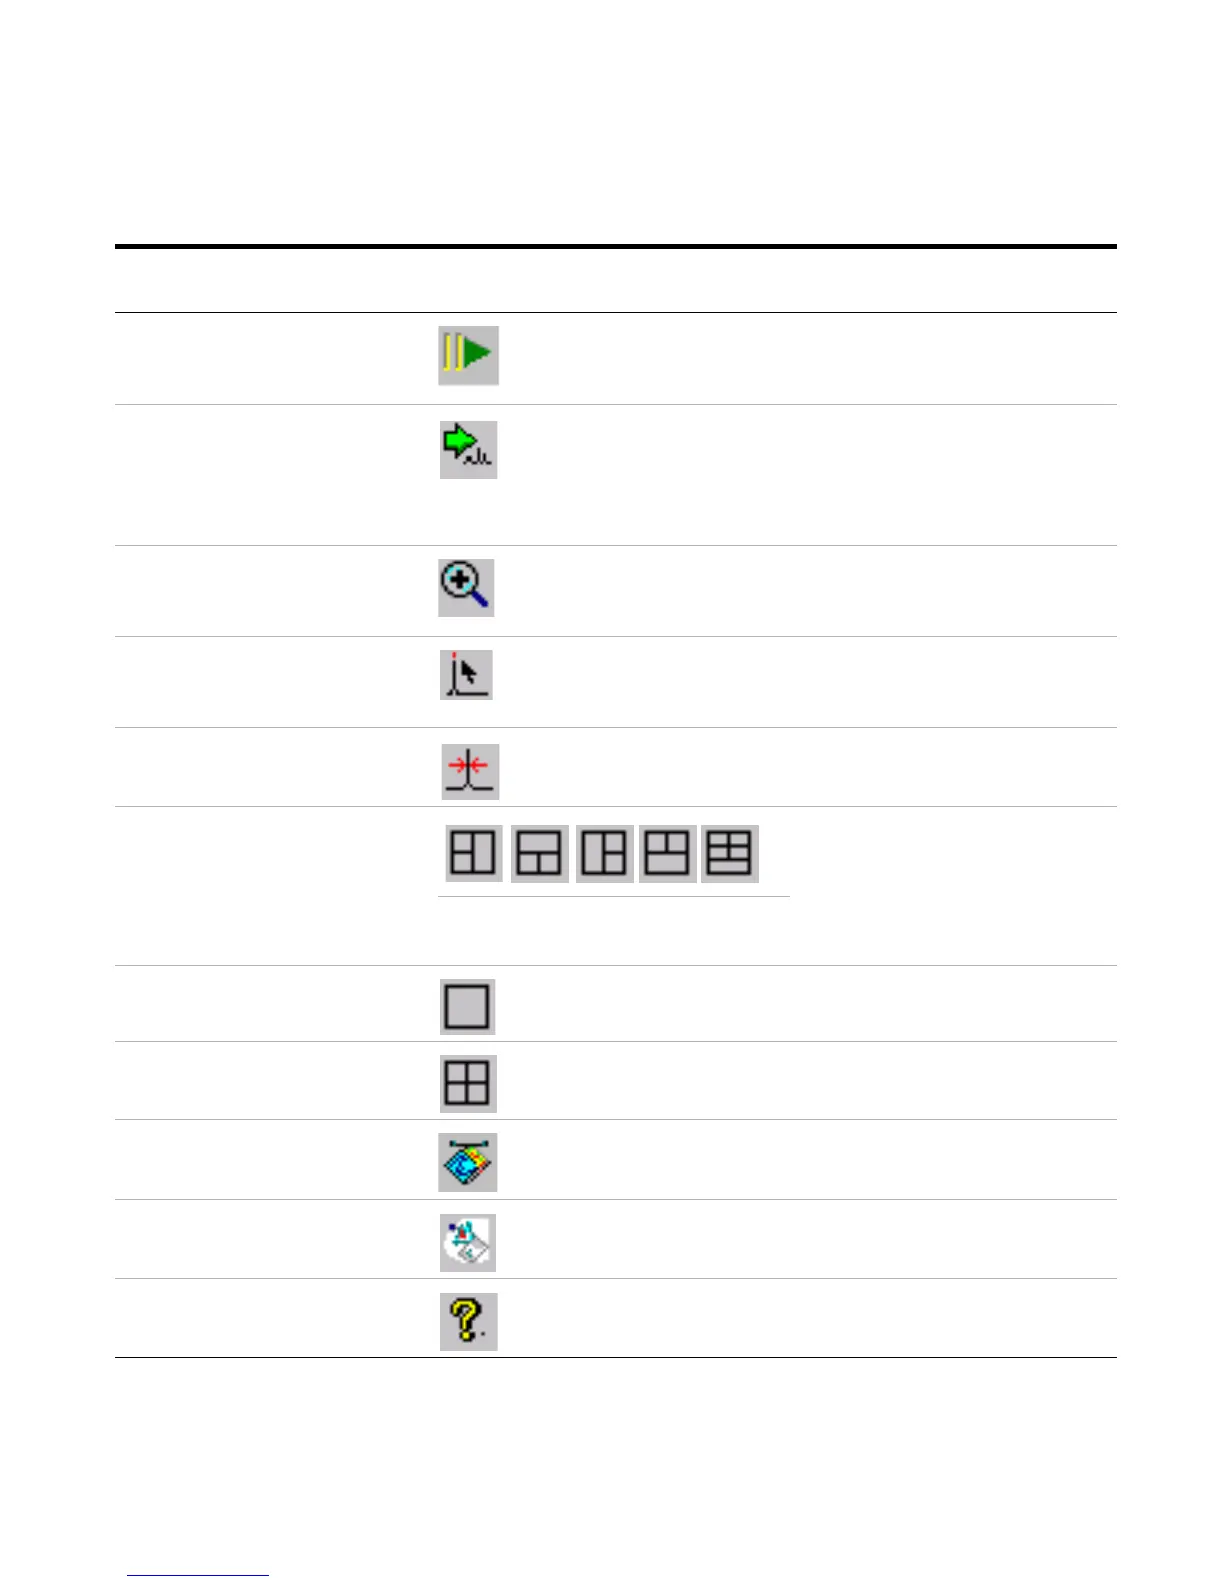
Continue the acquisition (after a
pause)
Acquisition > Continue (Ctrl+F5)
Save a single profile spectrum Acquisition > Save Profile Now
(F7)
• Acquires a single data point as
a Profile spectrum to a data file.
• The name of this data file and its
location are prescribed in the
Sample Info tab.
Zoom in View > Zoom in (F9) Lets you draw a rectangle with the
mouse around the area to zoom.
Select the mass with the maximum
abundance to the left of the mouse
cursor position.
View > Maximum Cursor (F10) Click this button, position the cursor
and click the mouse button to do this.
Show peak width in Profile spectrum View > Show peak width in
Profile Spectra (Ctrl+W)
Change the arrangement of the
graphics windows (panes). The first
arrangement is the default partition.
Use arrangement #5 for AutoMS(n)
acquisition to see the MS spectra
above and the MS/MS spectra in the
middle. Drag the border of the chroma-
togram upward to see the middle.
View > Arrange Spectrum Windows > 1-5
Maximize the active spectrum
window
View > Maximize Spectrum
Window
Tile the spectrum windows View > Tile Spectrum Windows
Show the LC program View > LC Program (Shift+F11)
Show DataAnalysis Program View > DataAnalysis (F11)
About MSD Trap Control Help > About...
If you intend to do this: Click this toolbar button or select this
menu item from the top menu:
Additional information
 Loading...