14 Agilent 1100 Series LC/MSD Trap System Quick Start Guide
Display panes
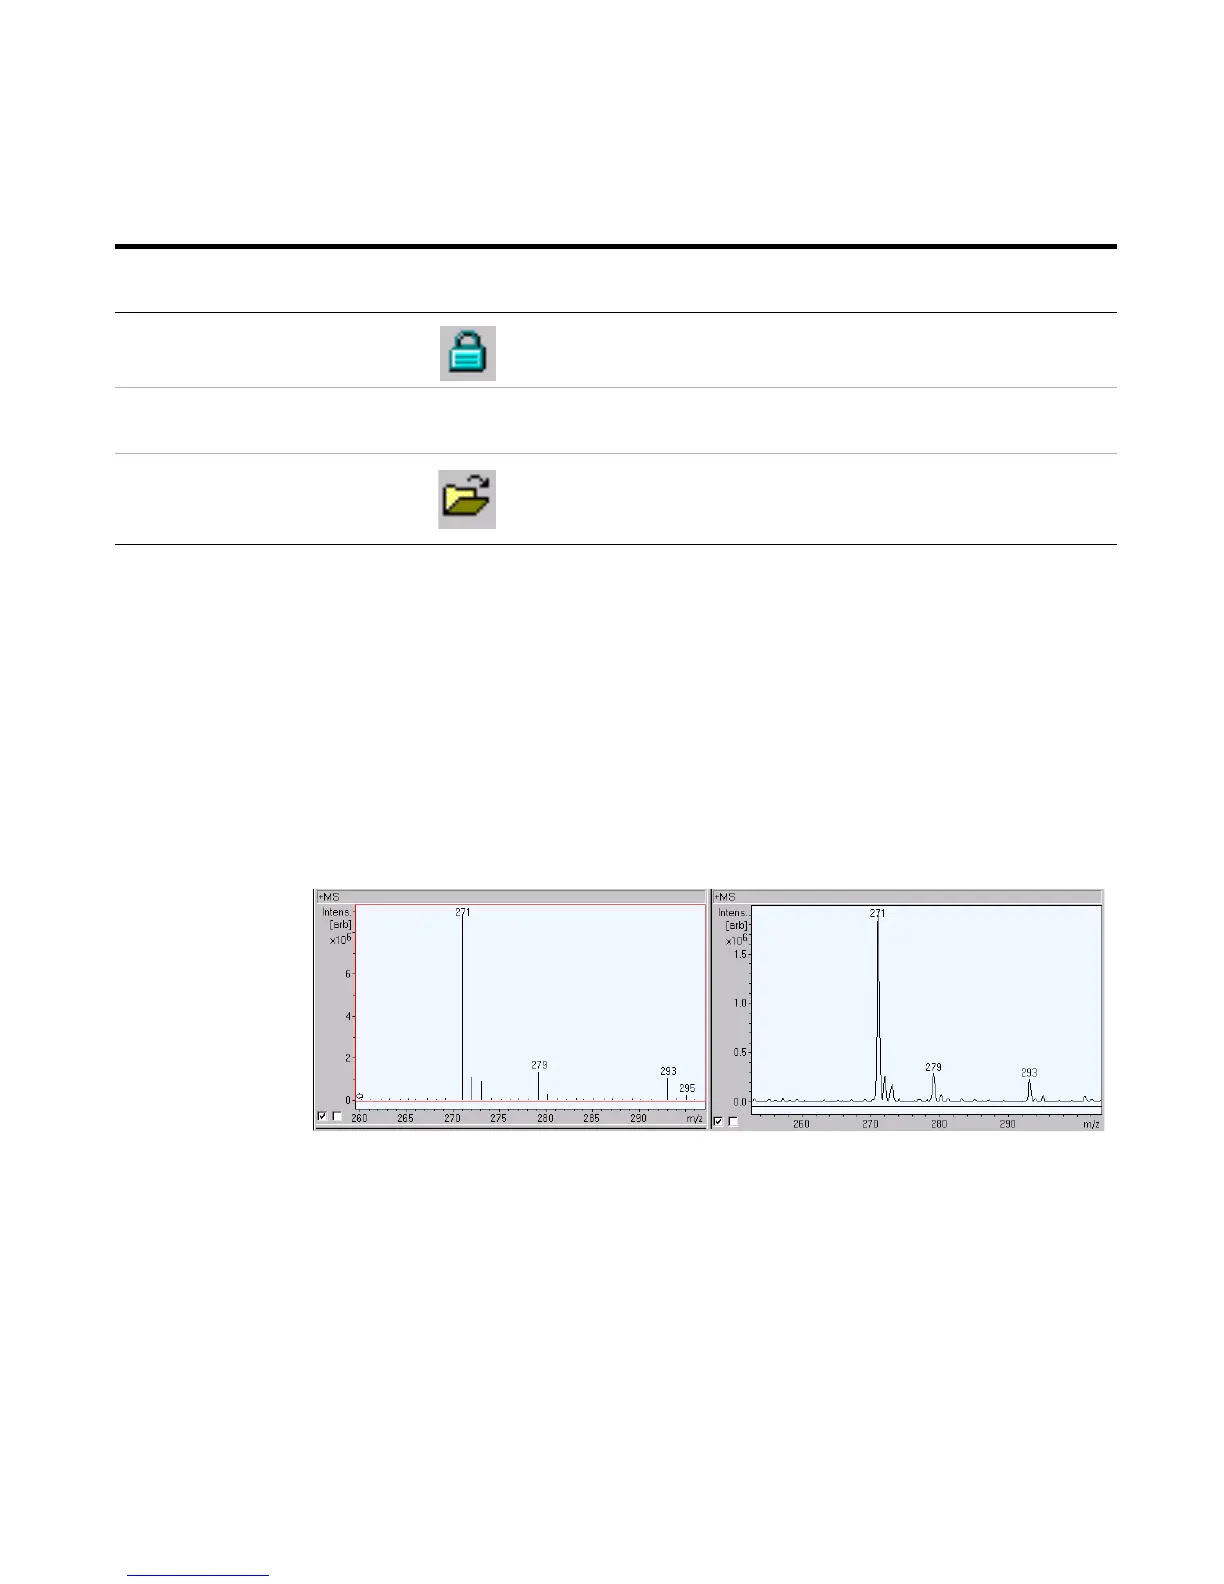
Line and Profile spectral panes Line spectra do not show peak widths because all
of the Profile peak intensities within a range determined by the Line spectrum
algorithm have been summed and grouped into a single Line spectrum peak.
• To compare Line and Profile spectra:
a Clear the right-hand check boxes in the lower left corner of each spectral pane.
b To adjust the frame border move the cursor to the edge and click and drag the
border until your screen appears as in Figure 3.
Lock all applications Help > Lock all Applications
(Ctrl+Alt+K)
• Available only after installation of
the LC/MSD Trap Security Pack
Print or preview the chromatogram
and spectrum panes
File > Print
File > Print Preview
Open an Analysis file and the method
from this file
File > Open Analysis File
(Ctrl+D)
If you intend to do this: Click this toolbar button or select this
menu item from the top menu:
Additional information
Figure 3 Comparison of a Line spectrum and Profile spectrum
 Loading...