DRAFT
September 25, 2007 1:07 am, 4376782_Maintain_the_System.fm
Chapter 6 Maintain the System
Regular Maintenance
Applied Biosystems StepOne
™
and StepOnePlus
™
Real-Time PCR Systems
Installation, Networking, and Maintenance Guide
102
Notes
About the
Analysis
The product of a dye calibration is a collection of spectral profiles that represent the
fluorescence signature of each dye standard. Each profile consists of a set of spectra that
correspond to the fluorescence collected from the wells of the spectral calibration plate.
The StepOne
™
software plots the resulting data for each spectral profile in a graph of
fluorescence versus filter.
When the StepOne
™
software extracts the calibration data from a dye run, it evaluates the
fluorescence signal generated by each well in terms of the collective spectra for the entire
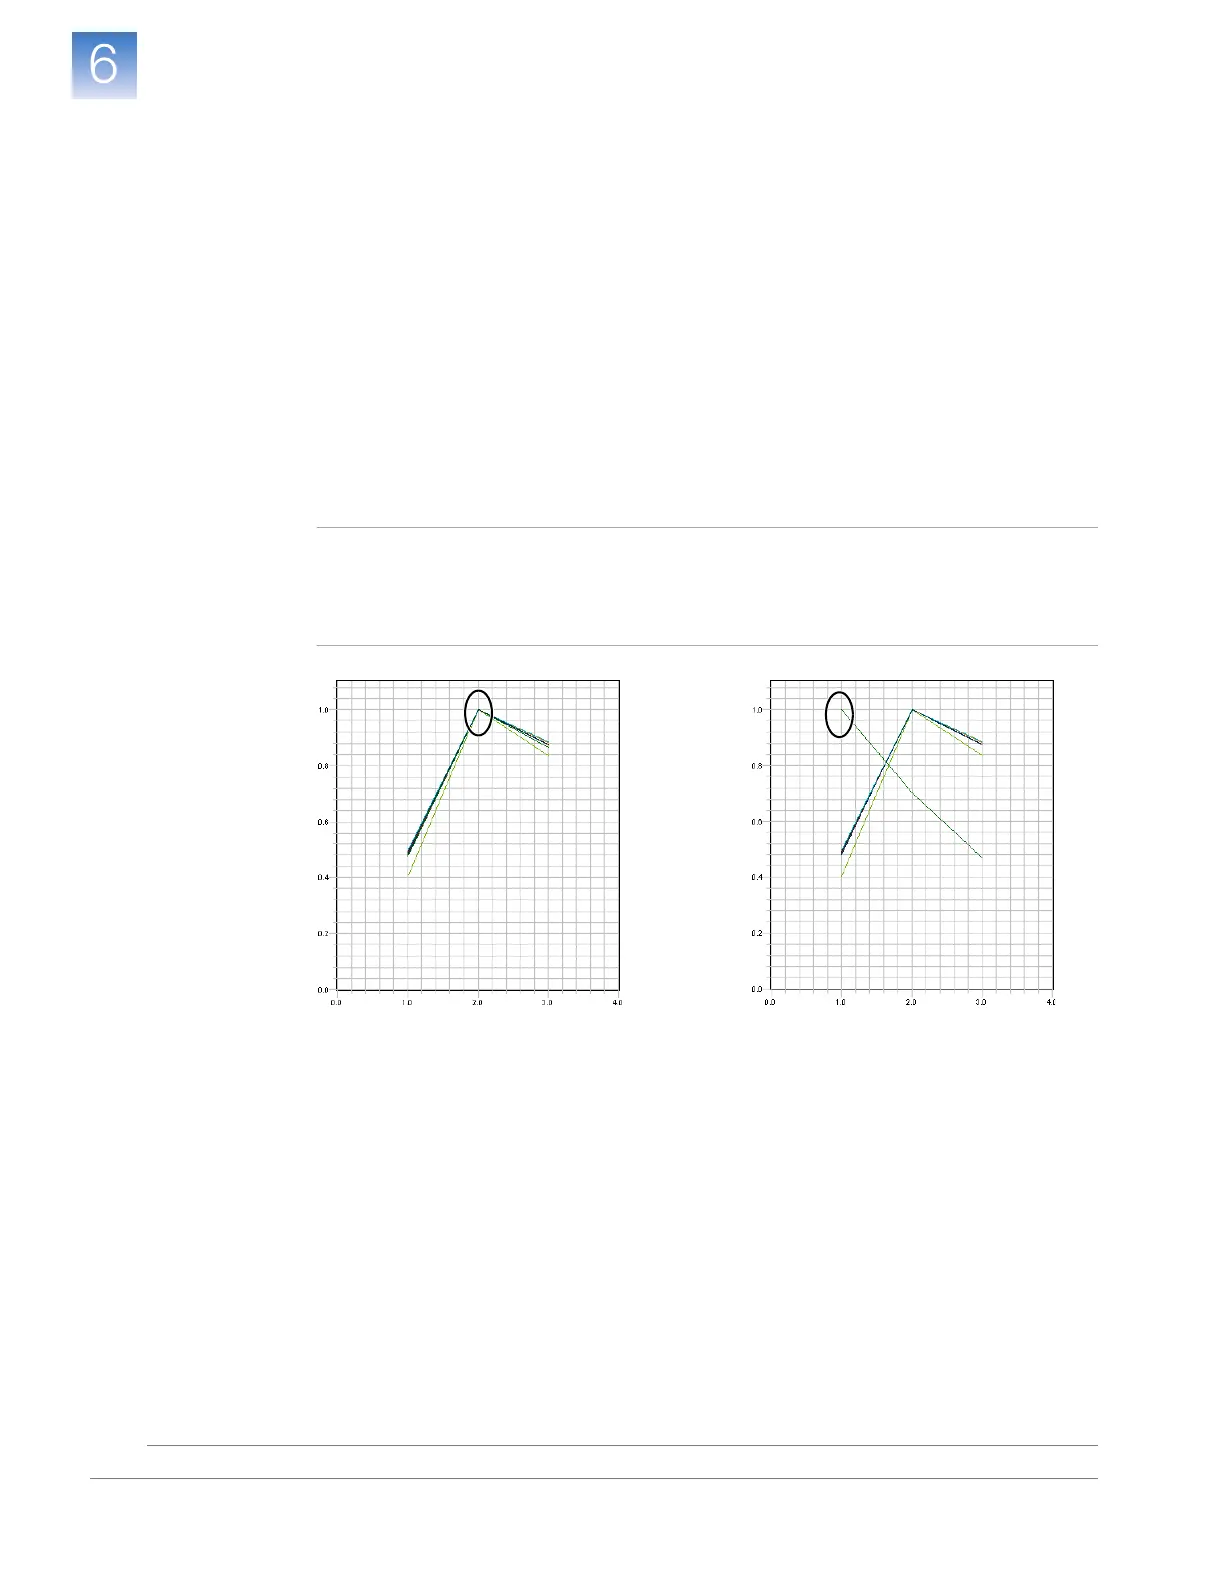
calibration plate. Dye spectra are generally acceptable if they peak within the same filter
as their group but diverge slightly at other wavelengths (see below).
The StepOne
™
software can compensate for some differences in a spectral profile by
replacing (auto-repairing) the spectra of unacceptable wells with the spectra of other
wells on the reaction plate. However, the software allows only a few replacements and
may reject the calibration if the spectra between neighboring wells vary significantly.
Note: Because the wells in a calibration plate contain dyes at identical concentrations,
the resulting signals for the wells containing each dye should be similar. Among wells
containing the same dye, variations in spectral position and peak position are caused by
minor differences in the optical and excitation energy between the individual wells.
cceptable Spectra
Spectra peak at the same wavelength
and do not diverge significantly
Unacceptable Spectra
Spectra peak at the different
wavelengths