Do you have a question about the Cisco ASR 9000 Serie and is the answer not in the manual?
Isolates significant root messages by correlating related event records, suppressing secondary messages.
Filters alarms based on severity levels, displaying information by severity settings.
Defines root cause and non-root cause alarm messages for effective logging correlation.
Activates correlation rules and defines their scope across the router, locations, or contexts.
Shows how to display alarms filtered by severity levels or ranges.
Manages EEM policies by defining actions in routines called policies, which must be registered.
Uses Tcl scripts for EEM policies, defining events and actions via CLI commands.
Provides guidance on writing and customizing EEM policies using Tcl scripts for fault handling.
Describes sample EEM policies available in images for customization and event handling.
Lists various IP SLA operations to measure response times, jitter, throughput, and packet loss.
Explains the IP SLA Responder component for enhanced accuracy and proactive notification.
Diagnoses network suitability for real-time traffic applications like VoIP using UDP jitter.
Supports MPLS LSP ping and trace for troubleshooting connectivity and availability in MPLS VPNs.
Sets thresholds and triggers reactions for IP SLA operations based on monitored values or events.
Details sending syslog messages to various destinations like logging buffer, servers, or terminal lines.
Explains saving syslog messages to local storage like hard disk or flash disk with configurable attributes.
Guides on configuring logging destinations beyond the console terminal.
Customizes time-stamp format for syslog and debugging messages, including options for local time and milliseconds.
Describes OBFL data collection including baseline and event-driven information for FRUs.
Lists hardware components that support OBFL data collection.
Explains how to enable or disable OBFL for specific nodes or globally, highlighting its diagnostic importance.
Provides instructions on erasing all OBFL data from specific cards or all nodes.
Outlines Performance Management framework components: PM statistics server and collectors.
Details gathering and exporting PM statistics, including entities and associated instances.
Explains gathering statistics from specific entity instances for monitoring.
Describes configuring threshold conditions to monitor attributes and generate logging messages.
Covers configuring external TFTP servers and local disk dumps for PM data.
Provides examples for creating and enabling PM statistics and threshold monitoring templates.
Lists further resources for performance management topics.
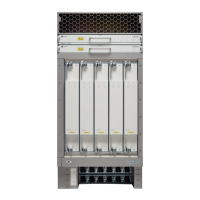
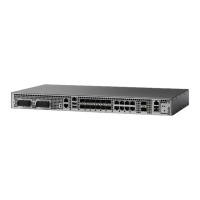
| Model | ASR 9000 Series |
|---|---|
| Product Type | Network Router |
| Operating System | Cisco IOS XR |
| Form Factor | Modular Chassis |
| System Capacity | Up to 96 Tbps per system |
| Ports | 1G, 10G, 40G, 100G, and 400G Ethernet ports |
| Expansion Slots | Multiple line card slots per chassis |
| Power Supply | Redundant power supplies |
| Cooling | Redundant fan trays |
| Routing Protocol | BGP, OSPF, IS-IS, EIGRP, MPLS |
| Management | CLI, SNMP, NETCONF |
| Redundancy | Power supplies, fan trays, route processors |
| Power Supply Options | AC and DC power options |
| Dimensions | Varies by chassis |
| Weight | Varies by chassis |