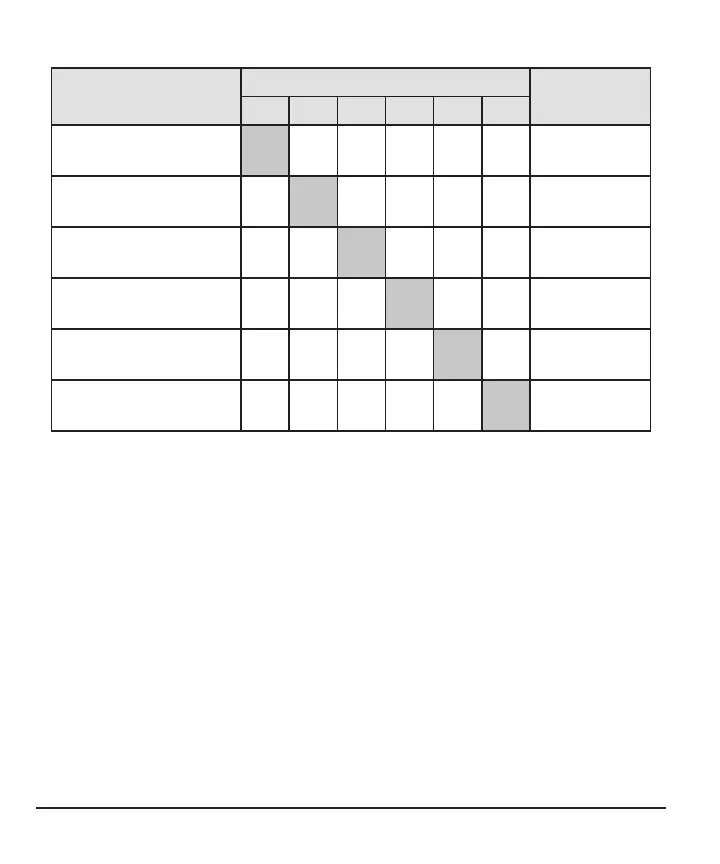
Table 4-B. Trend accuracy rate of change (pediatrics*; n=122)
CGM rate range (mg/dL/min)
YSI rate range (mg/dL/min)
CGM-YSI pairs (n)
<-2 [-2,-1) [-1,0) [0,1] (1,2] >2
<-2
71
(35.9)
75
(37.9)
38
(19.2)
12
(6.1)
2
(1.0)
0
(0.0)
198
[-2,-1)
43
(5.4)
382
(48.0)
313
(39.3)
48
(6.0)
9
(1.1)
1
(0.1)
796
[-1,0)
18
(0.7)
232
(8.4)
1,908
(69.0)
564
(20.4)
34
(1.2)
11
(0.4)
2,767
[0,1]
6
(0.3)
37
(1.7)
523
(24.1)
1,380
(63.6)
198
(9.1)
27
(1.2)
2,171
(1,2]
3
(0.4)
4
(0.5)
48
(6.5)
264
(35.9)
335
(45.5)
82
(11.1)
736
>2
0
(0.0)
5
(1.2)
20
(4.6)
44
(10.1)
133
(30.6)
232
(53.5)
434
* Includes pediatric subjects 7-17 years of age; no YSI measurements were taken for
pediatric subjects 2-6 years of age.
Hypoglycemic and hyperglycemic alerts
Low and High Glucose alerts
The ability of G7 to detect high and low glucose levels is assessed by comparing
sensor readings to YSI values at low and high blood glucose levels and determining if
the alert may have sounded. G7 and YSI values were compared by pairing the sensor
reading and the YSI value within before or after 15 minutes of each other. We suggest
that users ask their doctors what alert settings would be best for them.
138