9 • Reports | Dexcom G7 User Guide 85
9 • Reports
Reports on your display device are an important part of your CGM system, providing a
holistic view of your diabetes management by highlighting glucose patterns, trends,
and statistics. They can help you identify glucose patterns and, with your healthcare
provider, determine the potential causes of those patterns. Summary reports of your
glucose data over time give you useful information, such as:
l
Your overall glucose control or time in range
l
Your average glucose over time
Use the 3, 7, 14, 30, and 90-day reports to see how your glucose changes over time
with the information recorded in the display device.
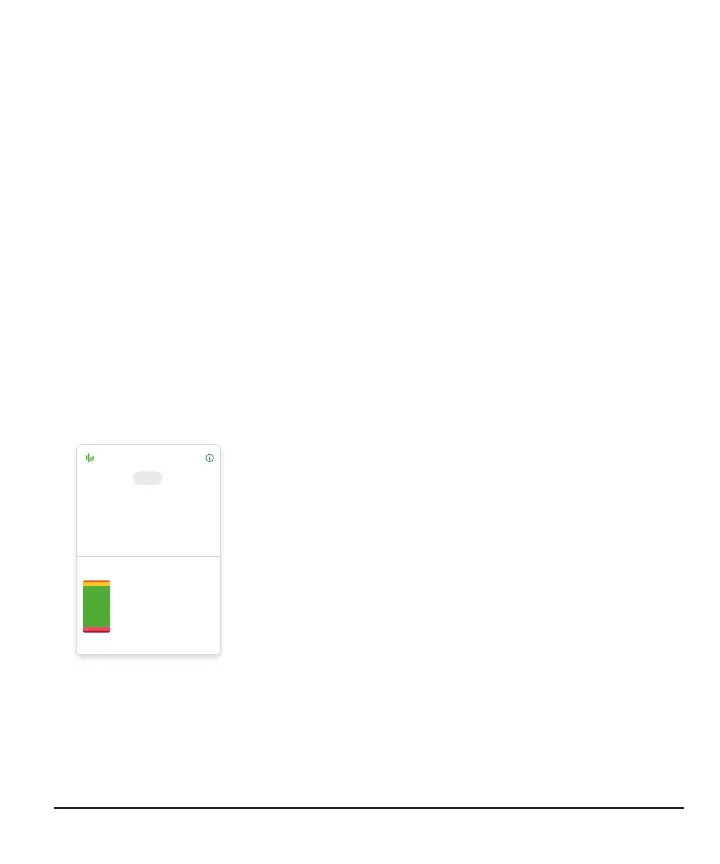
App
Scroll down in the Glucose tab to choose one.
+10% change since prior 14-day period
1% Very Low
9% Low
80% In Range
9% High
1% Very High
Time in Range
%
GMI
6.9
mg/dL
Average Glucose
147
14-Day Glucose Summary
Clarity
3 7 14 Days 30 90
Average Glucose: The average of all the sensor readings
in the selected date range.
GMI: Glucose Management Indicator (GMI) is calculated
using your average sensor glucose data. GMI can be an
indicator of how well you are managing your glucose
levels. Your GMI will likely differ from your A1C.
Time in Range: Shows the percentage of time that glucose
levels are in Low, Target, and High Ranges. The following
are recommended ranges from an international consensus:
l
Target Range: 70–180 mg/dL
l
Very High: Above 250 mg/dL
l
Very Low: Below 54 mg/dL
Go to dexcom.com/clarityapp for more detailed reports.