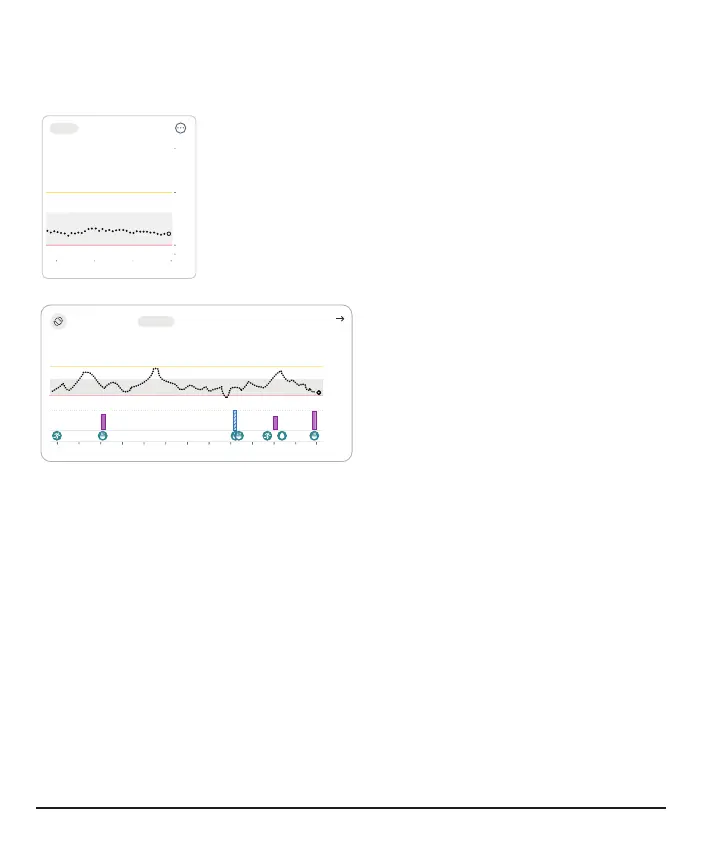
See trend graph history
App
Now121110
40
70
250
400
3 Hours 6 12 24
Tap the numbers above the trend graph to see your trend
graph over 3, 6, 12, and 24hours.
- 40
- 70
- 250
- 400
72
mg/dL
Now
3 6 12 24 Hours
2121086421210864
To see your event history in your trend
graph, turn your phone to landscape
and tap the numbers in the top left
side of the screen to switch between
3, 6, 12, and 24 hours of data.
Your current sensor reading and trend arrow are in the upper right corner.
If you added an event (for example, a meal) during the timeframe shown, it appears
below the graph. Insulin doses you tracked show in a separate row. This lets you see
how the events you tracked affected your glucose level.
Touch and hold the graph to see your glucose level at the time under your finger.
Touch, hold, and then drag over the graph to see your event and insulin details for that
time.
Tap the icon in the upper left corner to return to portrait mode.
36