Navigation
You can access other features using the navigation tools.
App
Glucose tab: Clarity card
+10% change since prior 14-day period
1% Very Low
9% Low
80% In Range
9% High
1% Very High
Time in Range
%
GMI
6.9
mg/dL
Average Glucose
147
14-Day Glucose Summary
Clarity
3 7 14 Days 30 90
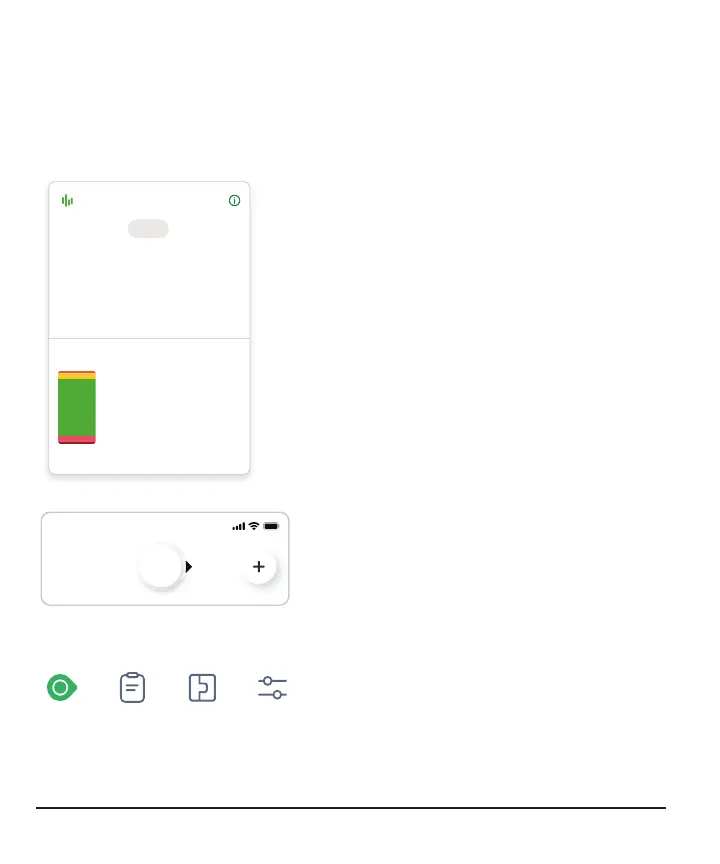
Scroll down in the Glucose tab to see the
card below the trend graph. It has your
Clarity glucose summary reports. The 3, 7,
14, 30, and 90-day reports show how your
glucose changes over time using the
information recorded in the app.
When you scroll down on your screen, you
still see a small version of your current
sensor reading and trend arrow at the top
of the screen.
History, Connections, and Profile Tabs
ProfileHistoryGlucose
Connections
Use the tabs at the bottom of the screen to
get to other features.
32