E • Technical Information | Dexcom G7 User Guide 141
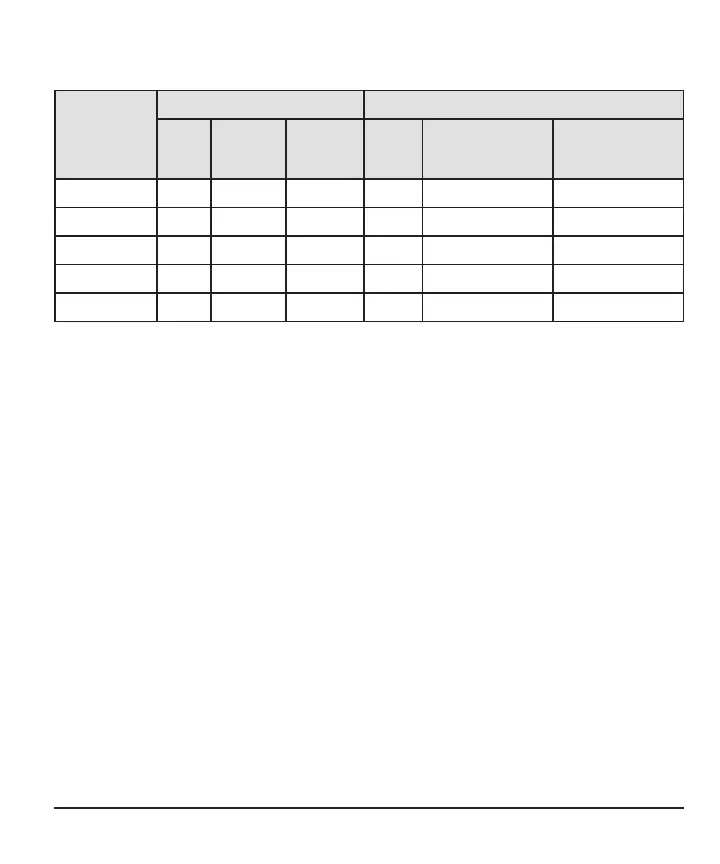
Table 5-B. Hypoglycemic alert and detection rate evaluations (pediatrics*,
n=122)
Hypoglycemic
alert level
(mg/dL)
Alerts Detections
# of
alerts
(n)
True alert
rate
(%)
False alert
rate
(%)
# of
events
(n)
Correct detection
rate (%)
Missed detection
rate (%)
55 462 36.8 63.2 106 80.2 19.8
60 728 59.9 40.1 288 89.2 10.8
70 1,543 81.5 18.5 976 90.4 9.6
80 2,477 89.9 10.1 1,692 92.5 7.5
90 3,415 92.4 7.6 2,059 96.8 3.2
* Includes pediatric subjects 7-17 years of age; no YSI measurements were taken for
pediatric subjects 2-6 years of age.
1
All subjects were considered in the analysis; however, not all subjects experienced a
hypoglycemic event.
The High Glucose alert
Estimates of how well the adjustable High Glucose alert performs are presented in
Tables 5-C and 5-D. Tables 5-C and 5-D represent the hyperglycemic alert evaluation
within 15 minutes of each hyperglycemic alert in the study and the hyperglycemic
event evaluation within 15 minutes of the YSI value for adults and pediatrics,
respectively.
Hyperglycemic alert rate
The alert rate shows how often the alert is right or wrong. The true alert rate is the
percentage of time the blood glucose level was at or above the alert setting within 15
minutes before or after the device alerted. The false alert rate is the percentage of
time the blood glucose level was below the alert setting within 15 minutes before or
after the device alerted.