50
STORED DATA FUNCTIONS AND DISPLAYS
The Xplorer offers a graphical, information-packed, and easy to navigate
display of event data. Trend, Event List, Event Plot, and Event Waveform
are available for display, with options to view detailed information in
graphic as well as textual form. The Xplorer also does Voltage (Quality of
Supply or QOS) compliance monitoring as specified by EN50160, or
other similar voltage compliance standards.
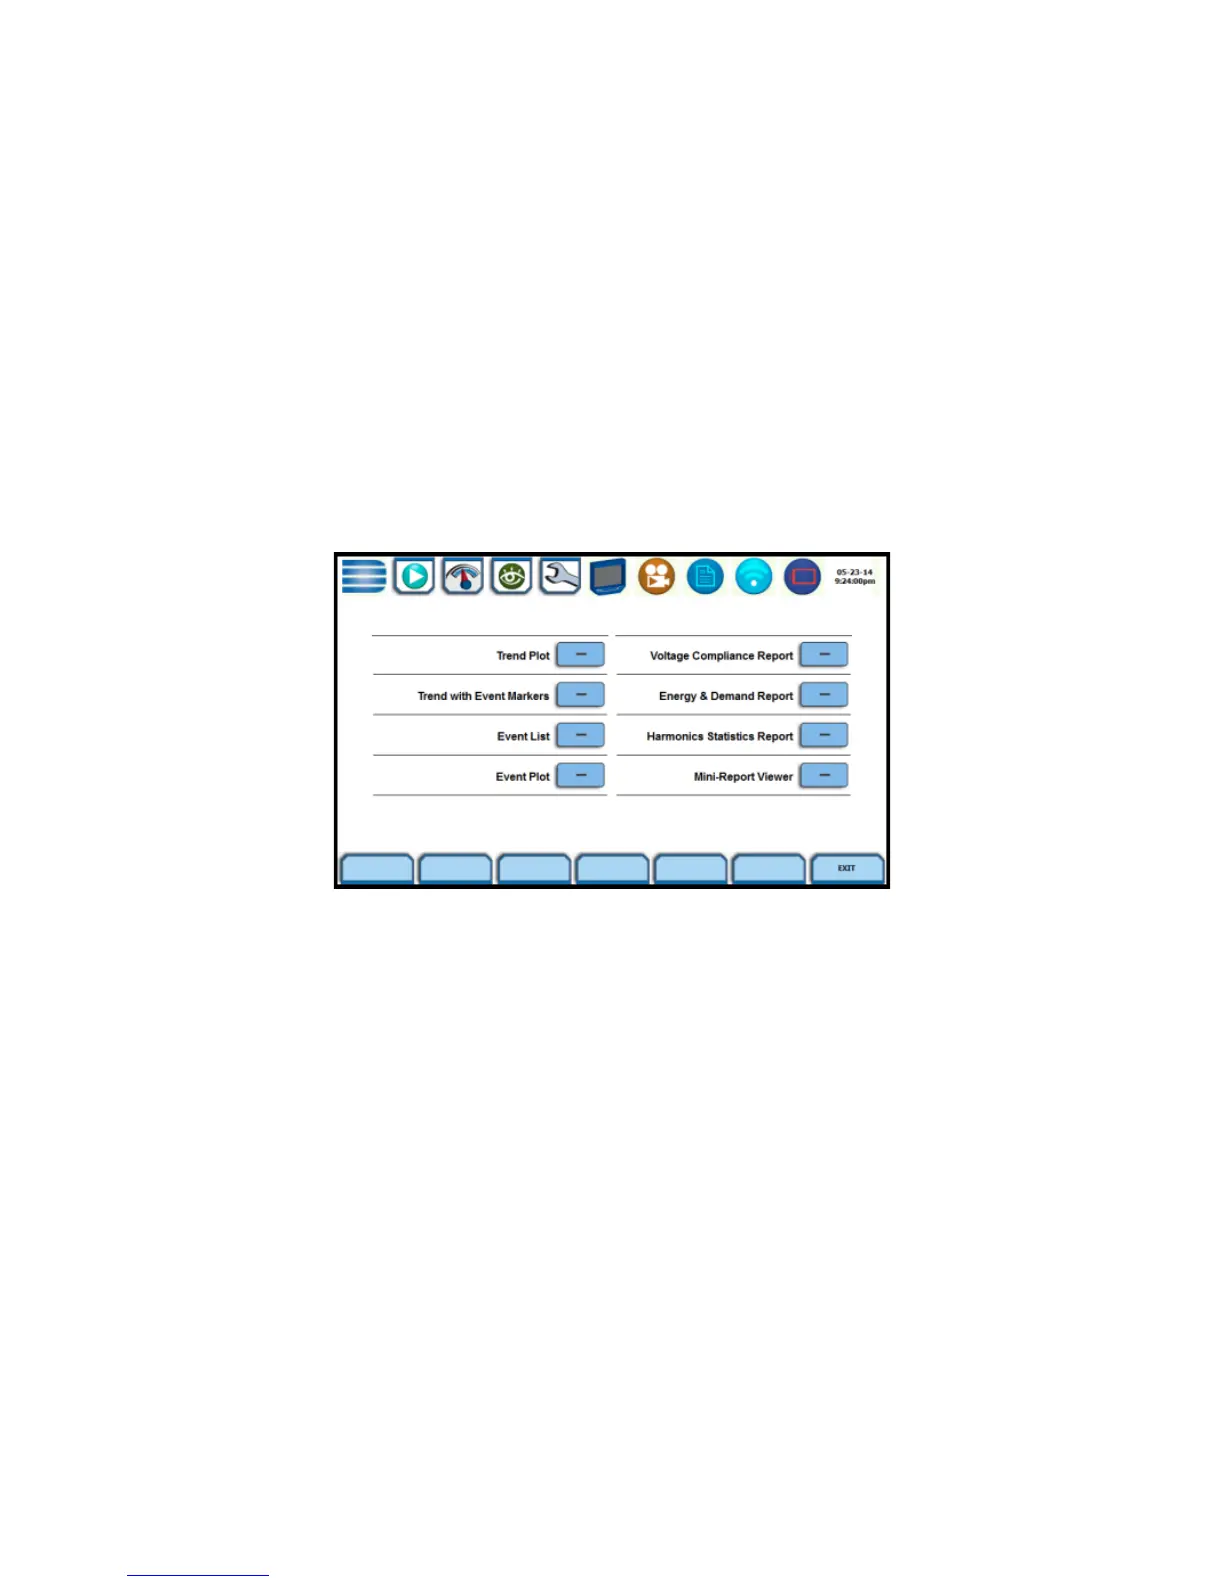
Event Data and Reports Menu
Event data and reports become available while monitoring is on or upon
reading a file from internal memory or external flash drive. Press the
Recorded Data icon to bring up the Event Data & Reports menu. While
monitoring is on, you can use the Data Review icons to bring up the
same data and reports menu.
The Event Data & Reports menu lets you select how to display recorded
data, either in graphic or textual form. These include both trended data
and events generated from user programmed triggers or thresholds.
What are Events?
An event occurs when a programmed threshold limit is crossed. An event
consists of the pre-trigger cycle(s), trigger cycle(s), and post-trigger
cycles(s), when available. The event data for all of the captured channels
can be displayed in time plots of the rms values or waveforms, event
details such as trigger conditions, characterization of the event according
to PQ standards, and min/max values, or the time-stamped event list.
What is displayed on a Trend?
It shows journalled (timed) event data trend over a specific time range.
Journals are periodic events recorded by the instrument at a specified
timed interval. The trend plot can show up to three (3) parameters, and
each parameter can then show up to four (4) channels on the same axis.