23
XPLORER HOME MONITORING PAGE
After the instrument has been powered up and monitoring is turned ON
(and subsequently if monitoring is DONE), the Home Monitoring screen
becomes the start-up page.
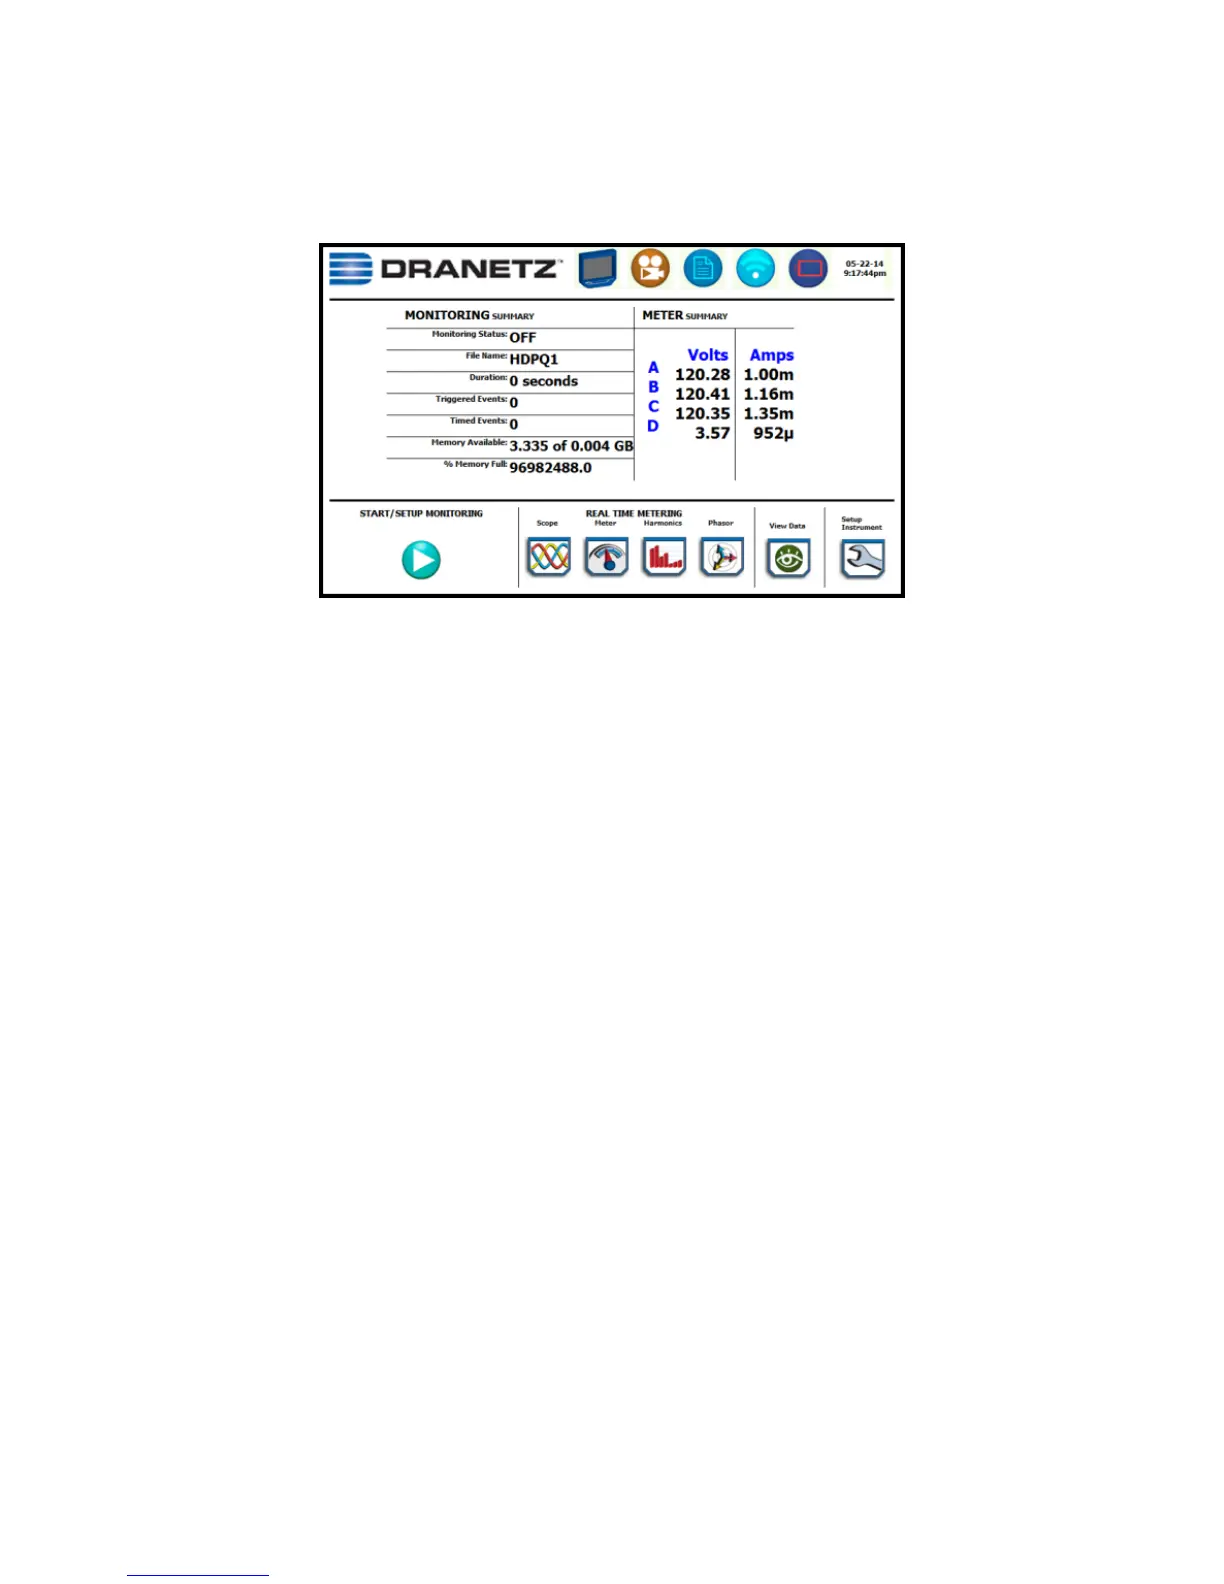
The Home Monitoring screen allows you to view monitoring status and
setups as configured. The taskbar located on top of the screen features
shortcuts to common instrument functions.
The monitoring summary includes:
Monitoring Status - On or Off
File Name - user specified or HDPQ Xplorer xx, where xx
increments every time data is saved using the same file name
Duration – length of time from the start of monitoring to the
present time while monitoring is on
Triggered Events – counts the number of events saved to
memory
Timed Events - counts the number of timed readings recorded
Memory Available - remaining free space in GB in memory
device
% Memory Full - percentage of used space in internal memory of
4GB
Icons to display the Start menu, access real time meters, view recorded
data and set up instrument are found at the bottom of the screen.