47
Text Display Meters (tabular)
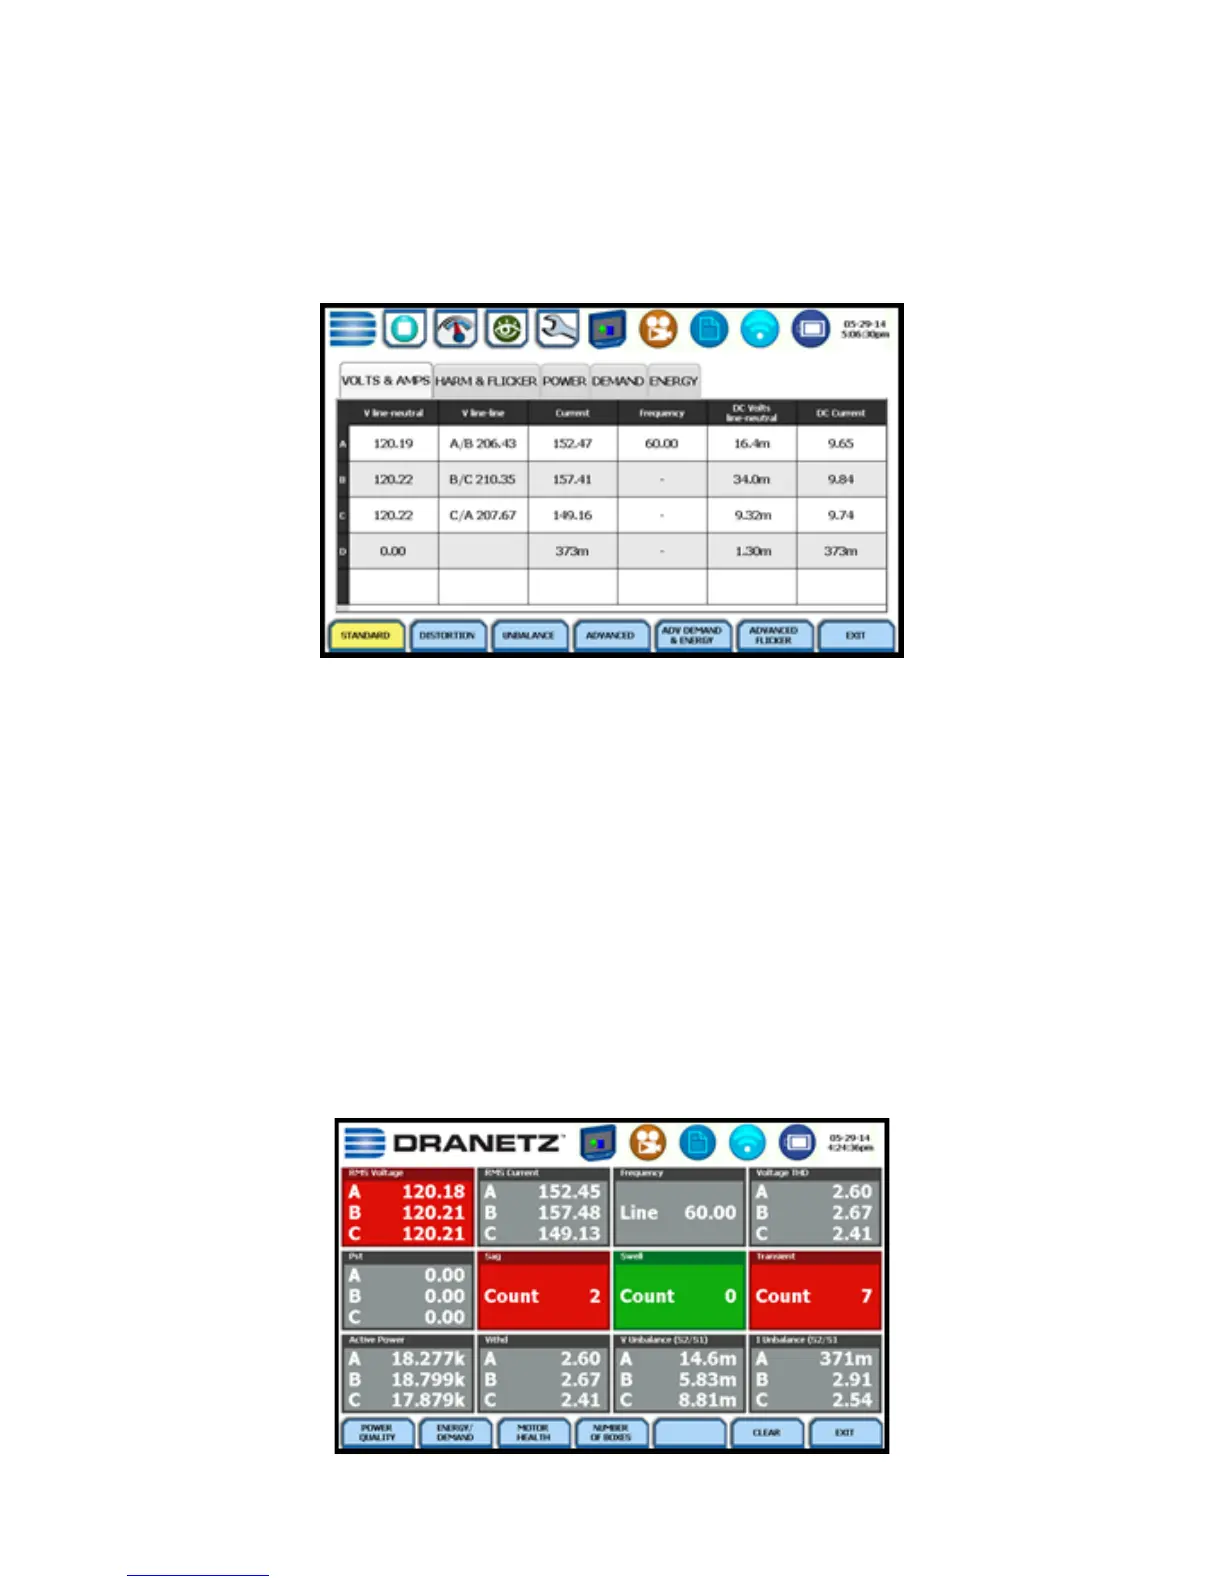
Text display meter screens are displayed in tabular form. The metered
parameters are logically separated into the following tabs: Standard,
Distortion, Unbalance, Advanced Power, Advanced Demand & Energy
and Advanced Flicker. The function keys at the bottom of the meter
screens change depending on the parameter tab selected.
NOTE: Meter mode operation does not interfere with any of other Xplorer
monitoring or recording functions.
Dashboard
The Dashboard is a visual way of seeing present values, and if any
events occurred, such as out-of-limit conditions, for each of the displayed
parameters. The Dashboard is color coded to indicate whether or not the
parameter is within limits. Green indicates the parameter is within limits
and/or no events have occurred since the Dashboard was last cleared.
Red indicates the parameter is extremely out of limits and/or events of
that type have occurred since the Dashboard was last cleared. It can
display status summary for three report types - Power Quality (PQ),
Energy/Demand and Motor Health. Real time data, event count, or user
specified calculated data is available in 2x3, 3x4, or 4x6 matrix displays.