53
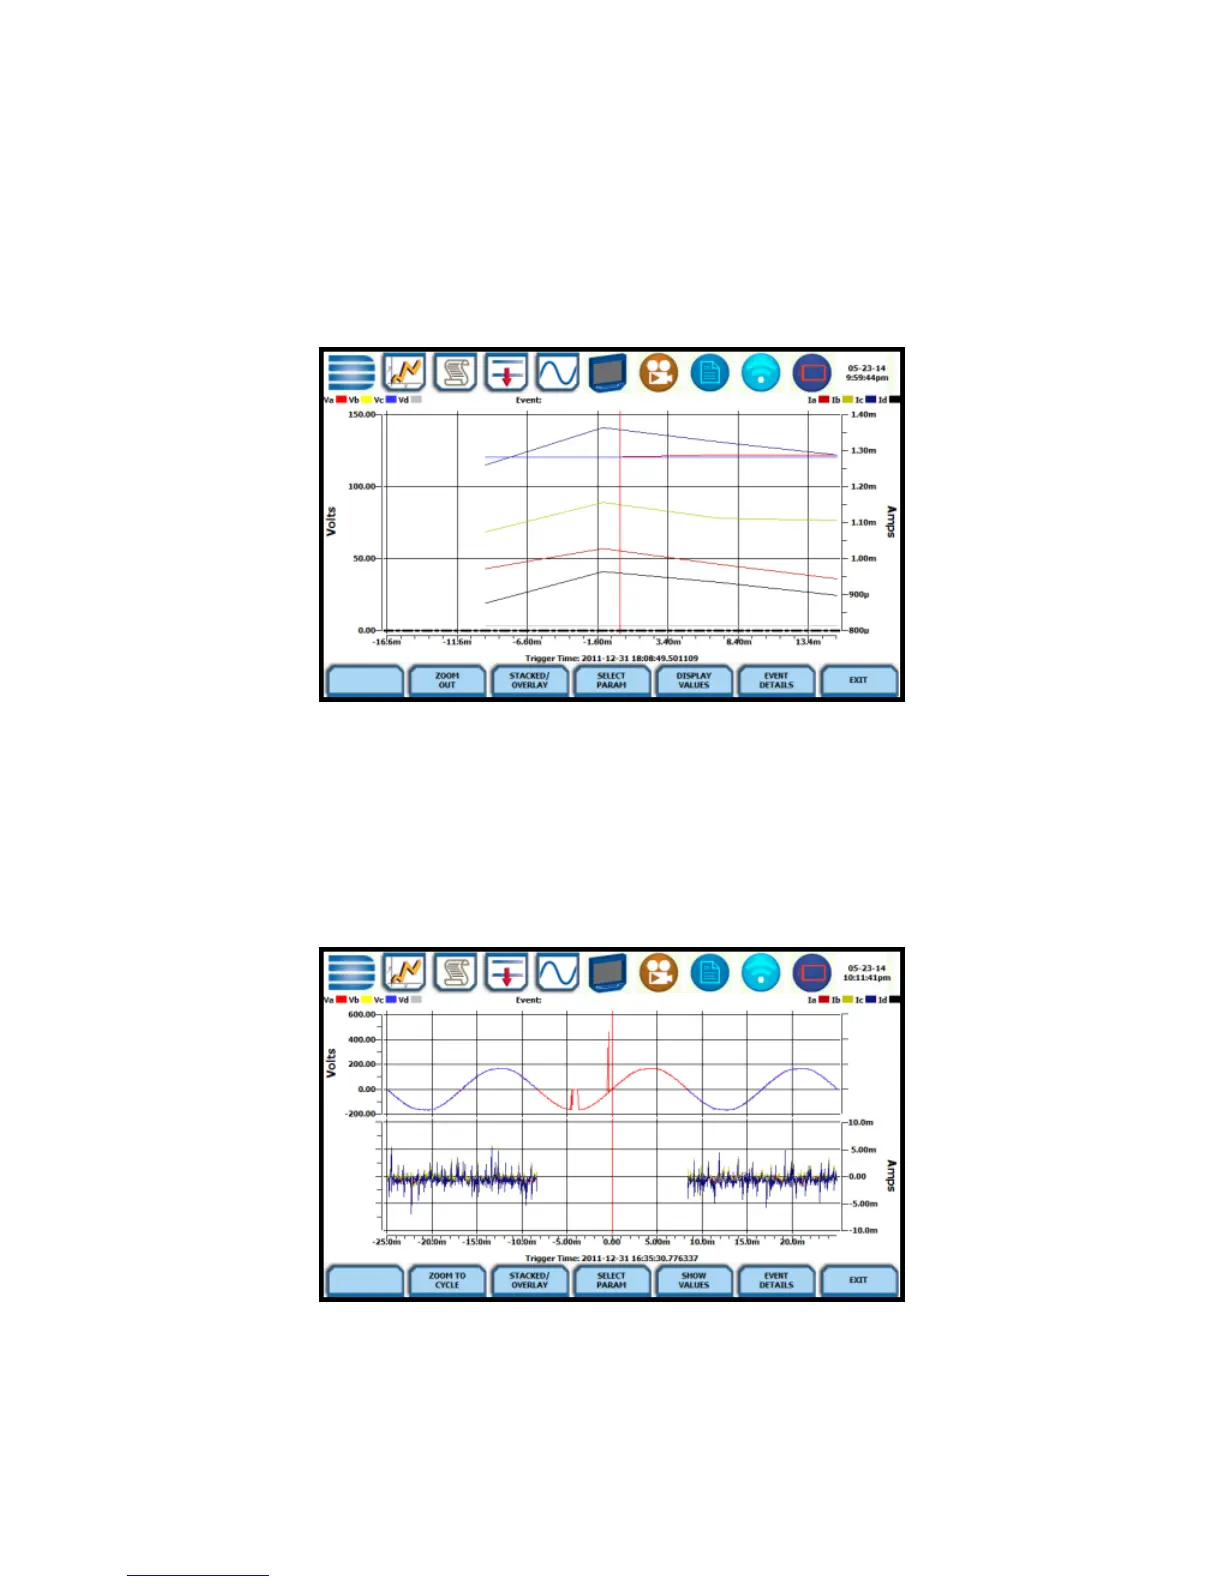
Event Plot (rms)
Event rms plot displays the actual voltage and/or current rms that
occurred when a certain threshold parameter was crossed.
The horizontal black dotted lines indicate the upper and lower limits that
trigger events. The Red vertical line indicates the trigger timestamp or
start of event.
Event rms plot of voltage and current
NOTE: Event plot displays events in rms by default. To view event plot in
waveform display, press the Waveform icon on the taskbar.
Event Waveform
The Xplorer allows you to view events in graphic waveform display.
Waveforms from transient event capture
NOTE: The instrument will only display waveform data for channels that
are enabled to record waveforms. For channels that do not have
associated waveform data, the screen will maintain the format, but will
leave the plot blank.