57
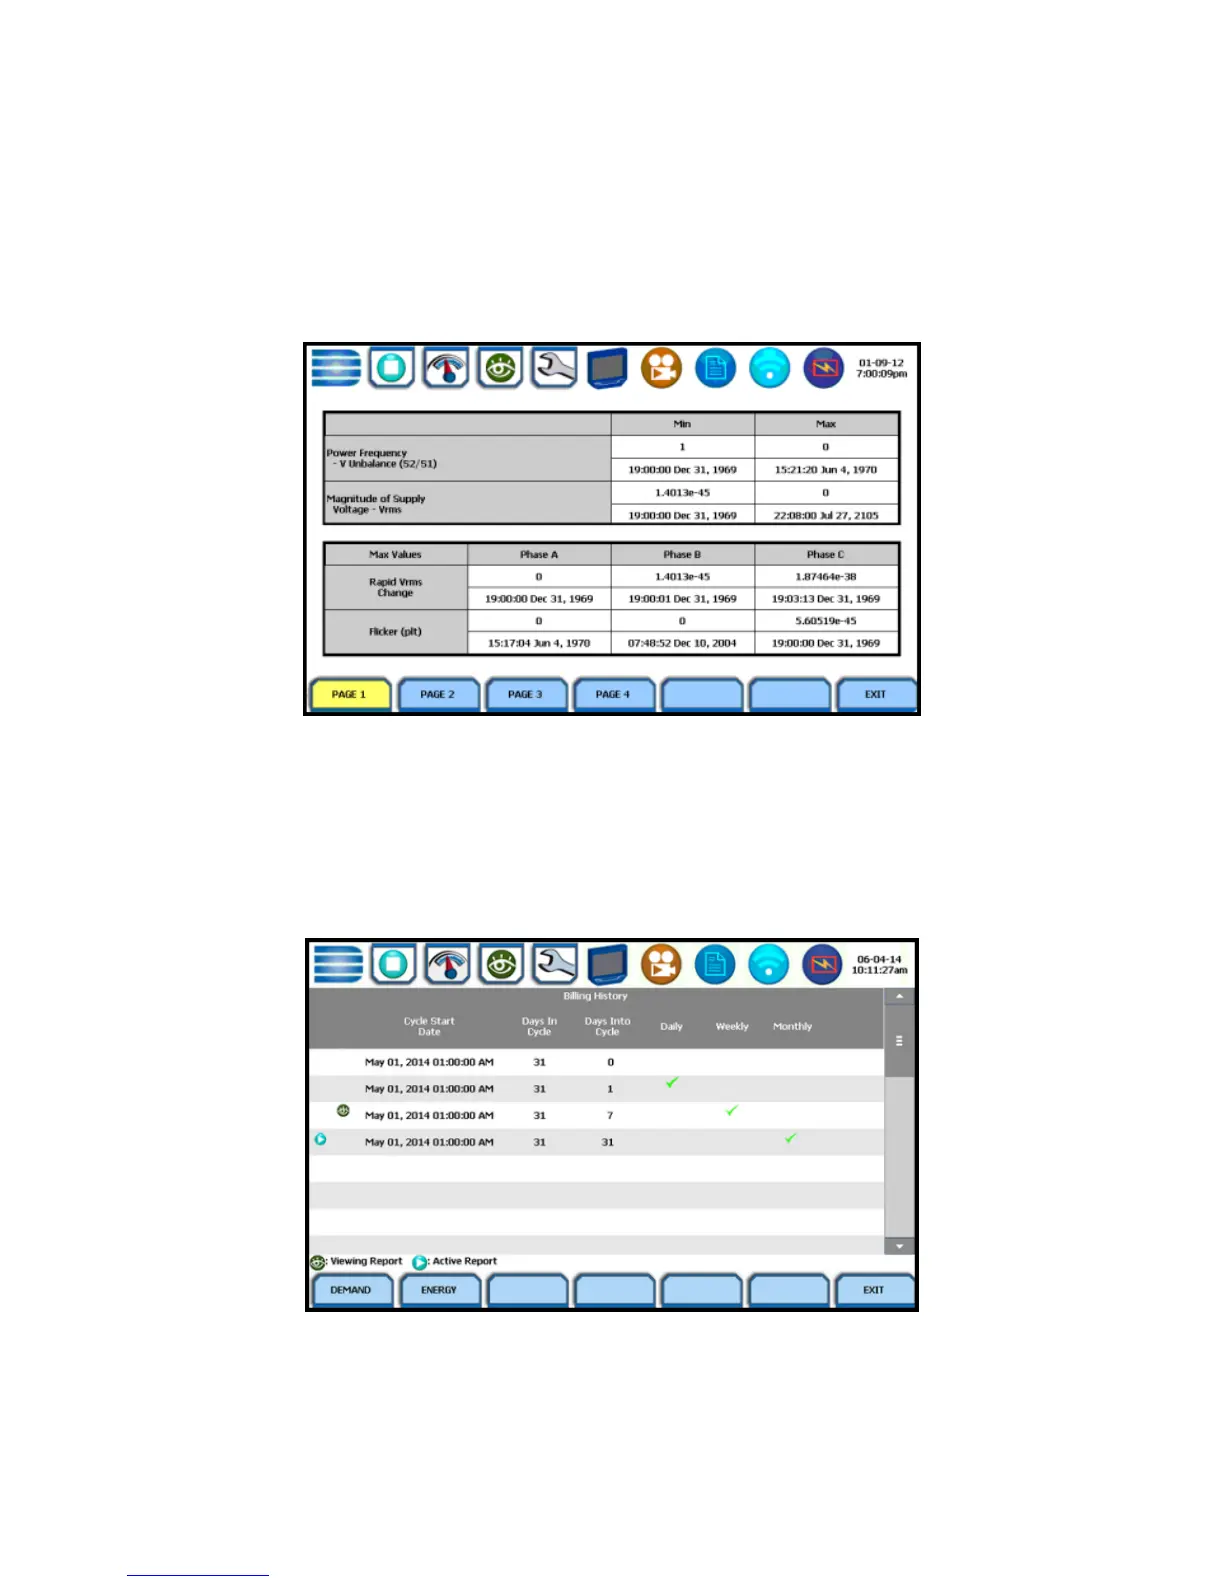
Min/Max
The Min/Max table displays the minimum and maximum values for
Power Frequency and RMS Voltage, along with the time and date of
occurrence. Maximum phase values of Rapid Voltage Change, Flicker,
Supply Voltage Unbalance, and Harmonic are also displayed along with
time and date of occurrence. Press the next pages to display the rest of
the table values and view Harmonic values up to order number 25.
Energy and Demand Report
The Xplorer gives you the option to view the demand and energy report.
The report list, as shown below, helps you monitor and manage energy
consumption including utility costs.
Use the function keys at the bottom of the screen to select Energy or
Demand report for viewing.