87
Freyss Diagram
It was designed to perform the bilateral bi-thermal caloric test. Freyss butterfly or
diagram shows the Nystagmus intensity together with the results of absolute
symmetry and preponderance.
In its most traditional form, Freyss butterfly represents the number of nystagmic flaps
observed in a 30-second period. It also requires the stimulus corresponding to
Hallpike rules: irrigate 125cc of water at 30 and 44° C during 30 seconds. The patient
shall be in horizontal position with the head at 30 degrees.
In these conditions, it is possible to use the results of the normative data published by
G. Freyss giving the symmetry normative limits (<15%) and a directional
preponderance (12%). It is also possible to evaluate a hypo-sensitivity condition (<30
saccades) or hyper-sensitivity (>122 saccades) of a single ear, if you add up the
saccades induced by both ears with hot and cold stimulus.
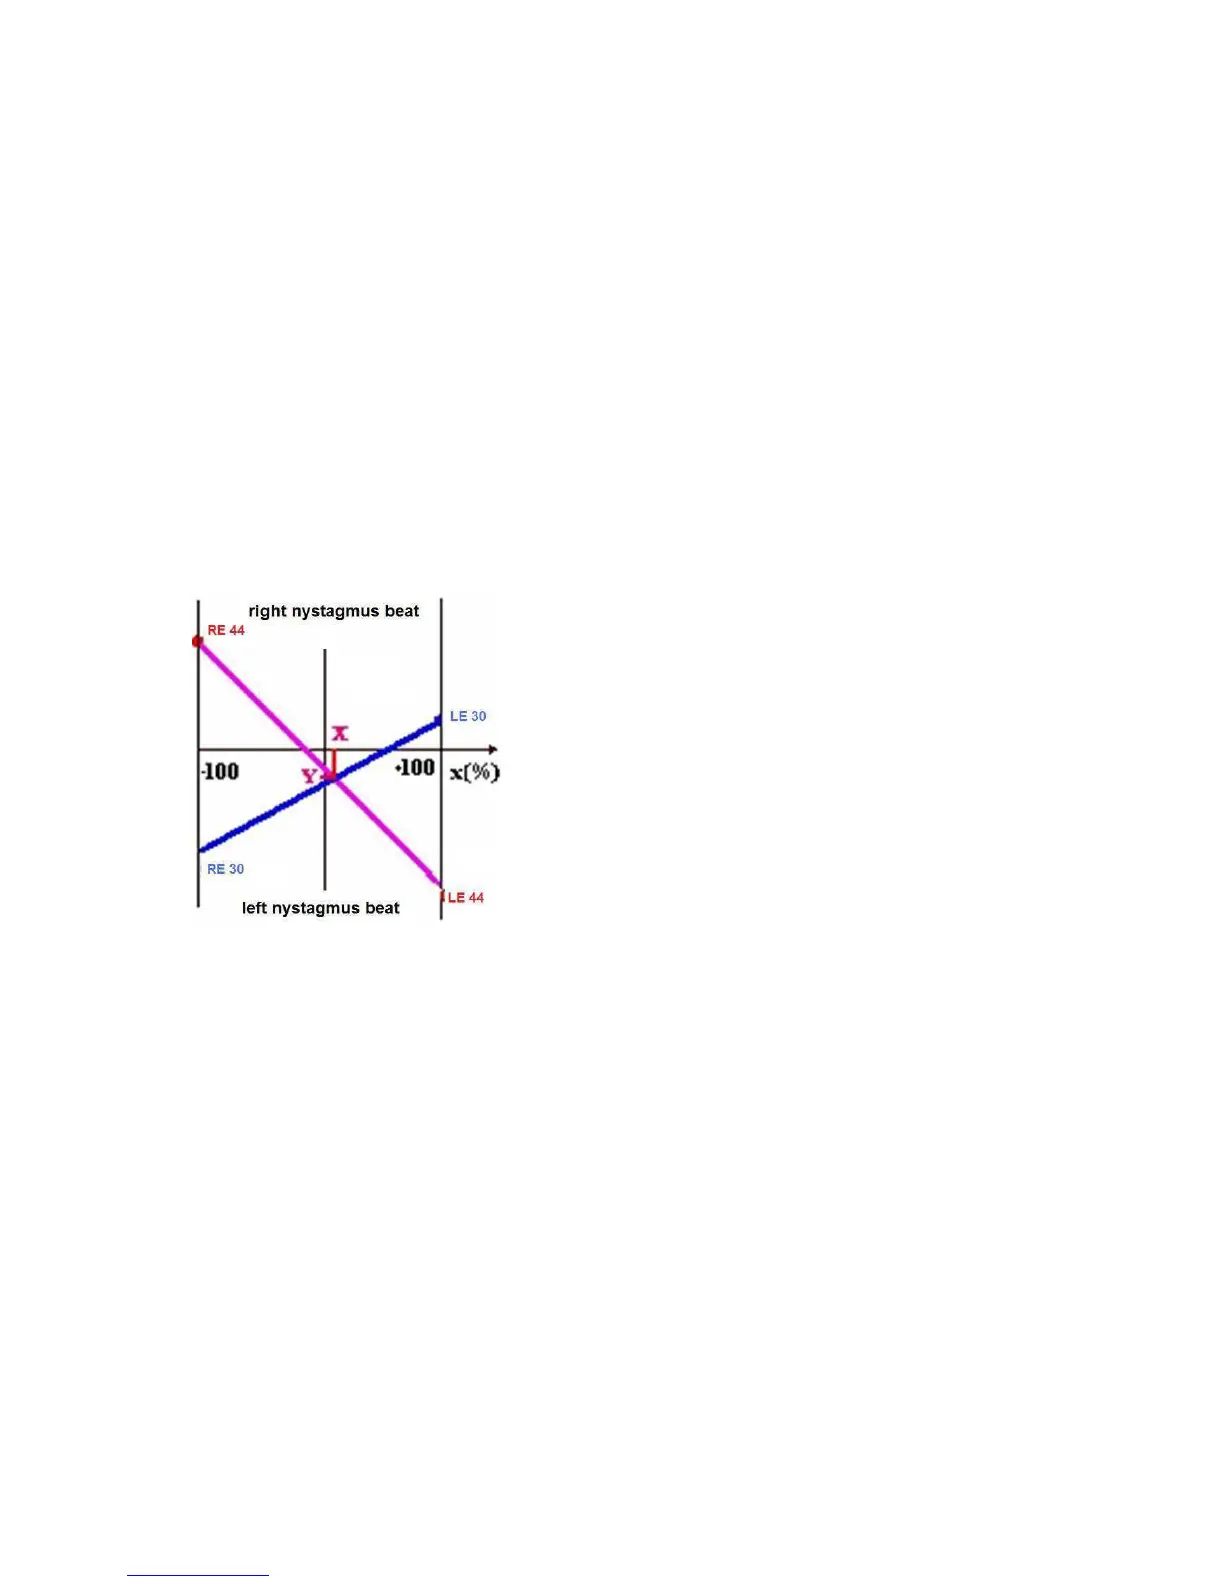
In general, the graph is centered in a point, the ordinate axis represents the
Nystagmus intensity and the abscissa axis is graduated in percentage. There are two
limits: x = +100 and x = -100. Rightwards
Nystagmus flaps are positive while the leftwards
ones are negative. The results obtained from the
right ear are represented in line X = - 100 and the
left ear ones in line x = +100. Both points
corresponding to the intensity measure of a
bilateral isotherm (cold or hot) are thus
connected defining a straight line and the
equation may be represented as y = a x + b
whose slope is positive for cold tests and
negative for hot tests.
Once the four tests are completed, then the
intersection
Point projections in X and Y of both straight lines
Represent the following two results:
In the vertical projection, the lateral symmetry value or channel paresis (X) is
represented in percentage. If the Nystagmus direction for each of the four tests is as
expected, then you may use the traditional Jongkee’s formula:
= RE44 + RE30) - (LE44 + LE30) x100 (RE44 - RE30 - LE44 + LE30)
In the horizontal projection, the absolute preponderance (Y) is calculated using the
following formula
= (RE44 * LE30 - RE30 * LE44) (RE44 - RE30 - LE44 + LEI30)
The hyper or hyposensitivity condition for each ear is assumed from segment length
covered by the butterfly wing in the axis: x = - 100 for the right side and x = + 100 for
the left side.
FREYSS DIAGRAM FOR SLOW PHASE SPEEDS