15.2 BATCH READINGS
(Batch/Review Batch/Readings)
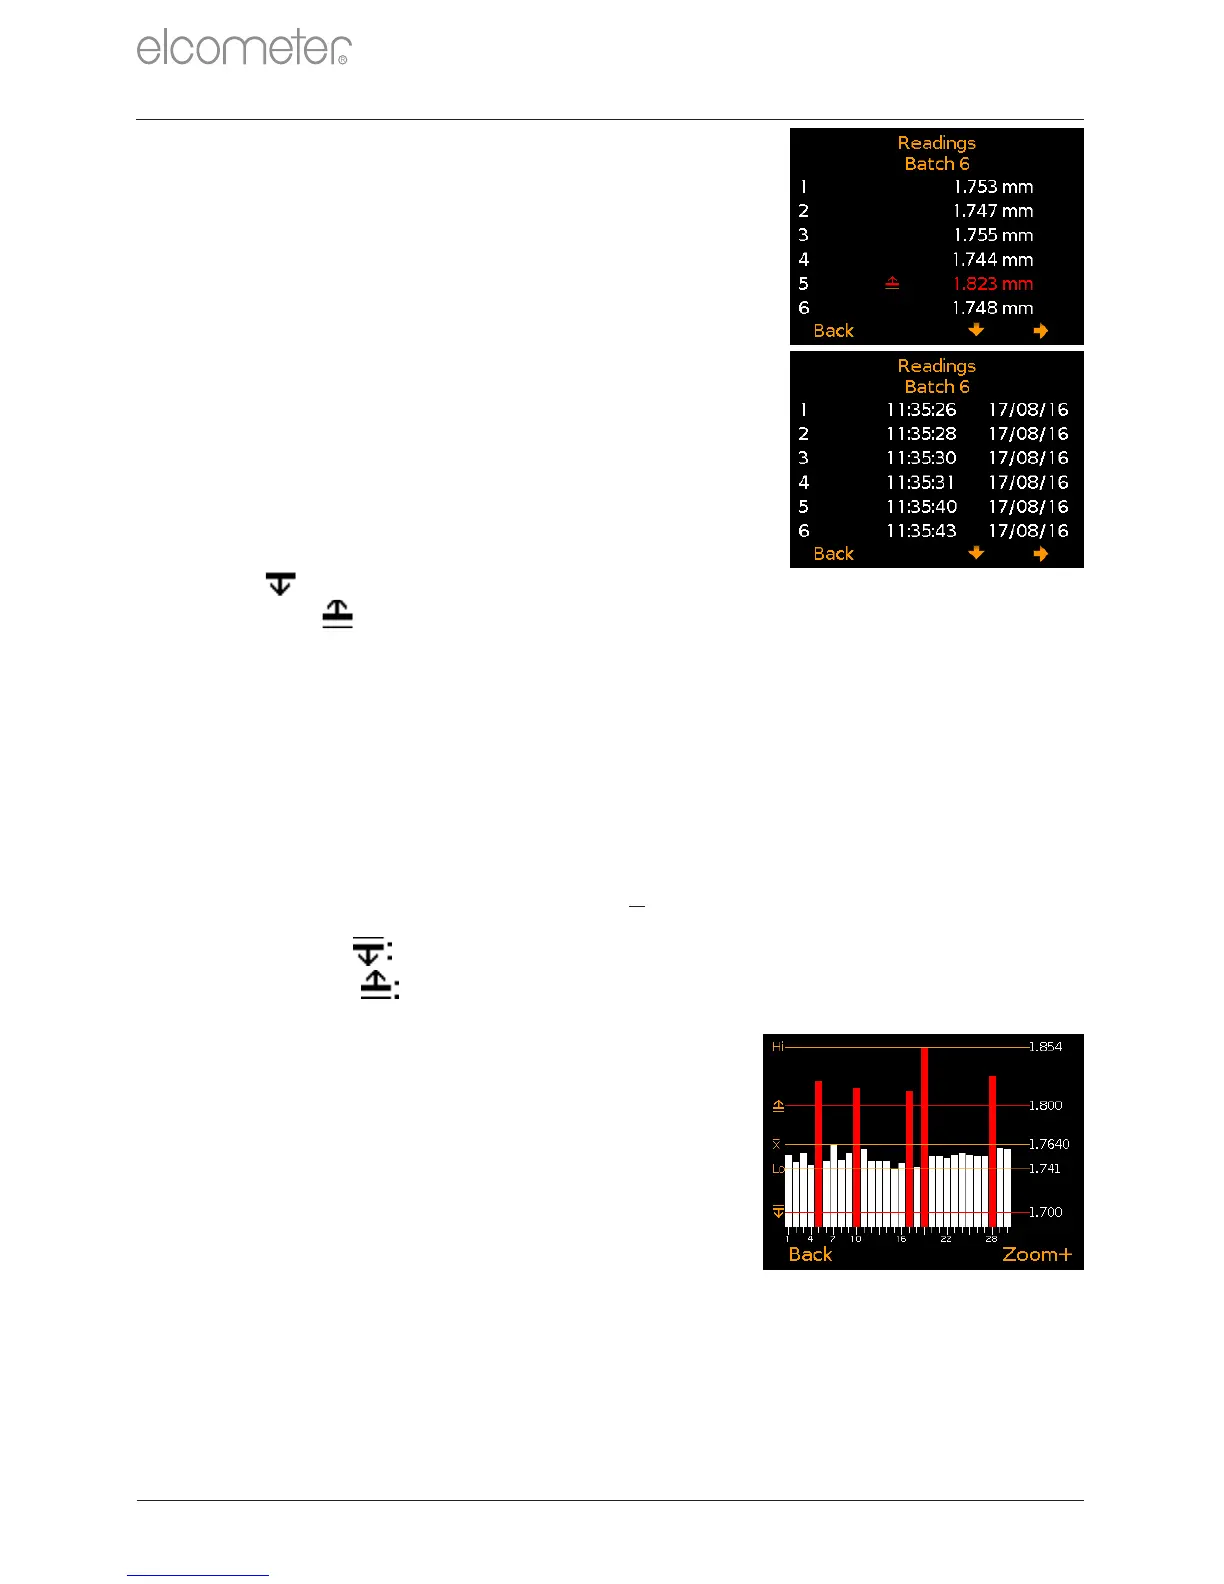
Displays the reading value together with
date and time stamp for each individual
reading in the batch.
Press the softkeys to scroll through
the readings and to move to the next
information screen (Figure 27).
Readings outside any enabled limits for
the batch are displayed in red with the
appropriate limit icon to the left of the
reading, ( ) if the reading is below the
low limit and ( ) if above the high limit.
15.3 BATCH GRAPH (Batch/Review Batch/Batch Graph)
Allows the users to view the readings within the batch as a column bar
graph. Up to five horizontal axes are displayed representing different
values / statistics as follows:
e
Highest reading in the batch (Hi:)
e
Lowest reading in the batch (Lo:)
e
Average reading for the batch (X:)
Low Limit ( ); when set and enabled
High Limit ( ); when set and enabled
If limits were not set and enabled, the
readings are displayed as white vertical
bars. If limits were set and enabled,
readings are displayed as white bars if
within set limits or red; if outside set limits
(Figure 28).
If there are more readings in the batch than
can be displayed on a single screen, multiple
readings will be combined into one bar.
Should a single reading within the ‘combined
bar’ be outside set limits, the whole bar will
be red.
www.elcometer.com
en-27
R
e
For batches of more than one reading.
Figure 27
15 REVIEWING BATCH DATA - MODEL T (continued)
Figure 28
 Loading...