Inspecting Fiber Ends
84 FIP-400B
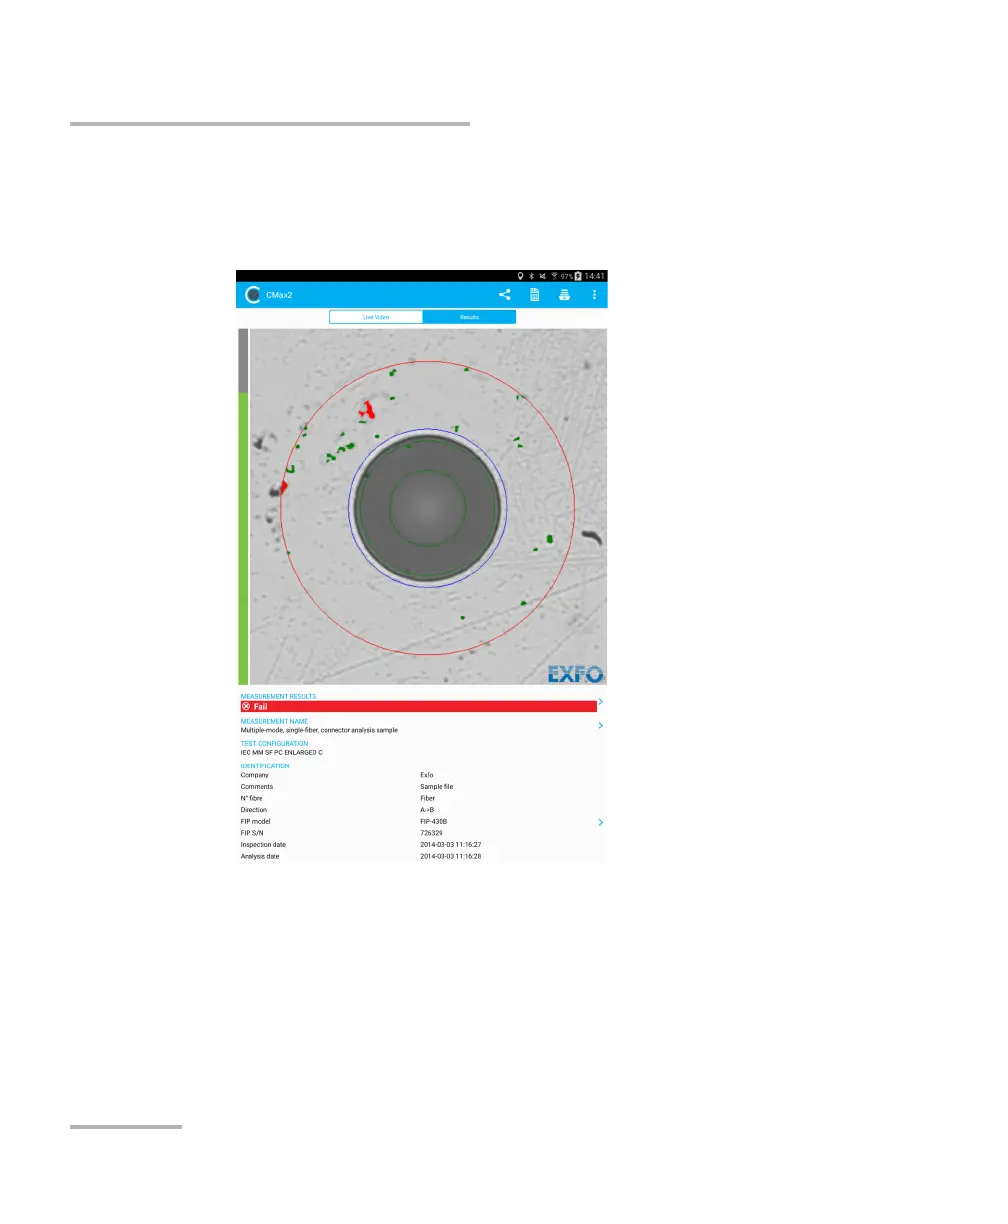
Analyzing Captures
The results are available as an image or in a detailed table.
The Image shows the snapshot of what has been captured. You can
see all the anomalies that have been detected.
The overlay shows the status of the analysis, the status per zone, the
analysis zones, any anomaly (defects, scratches) found on the fiber
endface. The color of the circles shows the status of the analysis zone:
Green: pass
Blue: no analysis was performed or the function is disabled
Red: fail