Version date: 04 April 2016
Shows a list of the present markers. Enables the user to alter the
marker descriptions and to delete markers.
By means of the buttons the user can quickly move to the
previous or next marker in the recording without having to zoom
out.
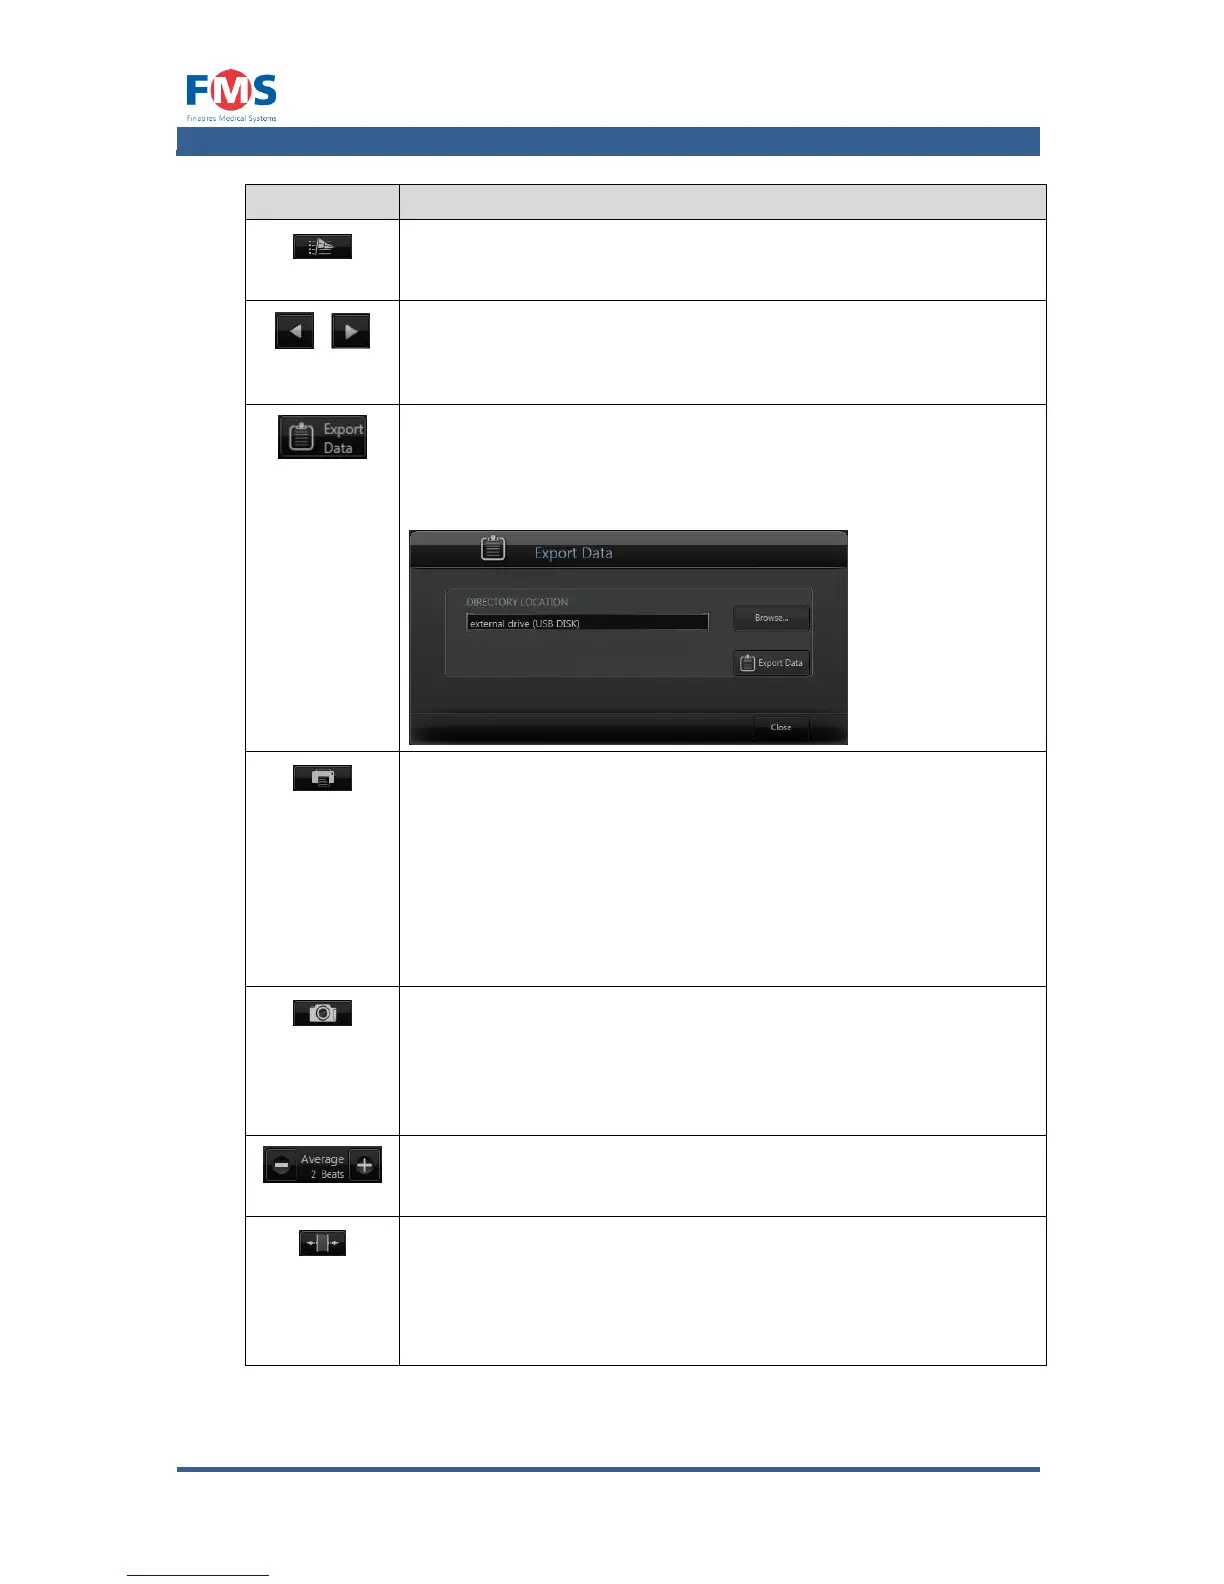
EXPORT DATA
Allows the operator to export the measurement data in CSV
format. A pop-up screen will open allowing the user to select the
directory (via the button) where the data will be exported to.
When pressing the button, the data is exported.
Opens a screen that enables the user to print the data of the
measurement. Besides the printer selection and printer options
the user can select the following options:
Print the complete measurement or only the WAVEFORM
or BEAT-TO-BEAT graphs.
Whether or not to print FRONT SUMMARY PAGES, and if
selected which information should be on it.
Determine the scale of the print out.
Makes a screen shot of the screen. The picture will be saved as
yyyy-MM-dd_HH_mm_ss.jpg in the subfolder Screenshots in the
measurement data folder. It is automatically exported with a
measurement file when it is downloaded to an external storage
medium.
AVERAGE BEATS
Determines, by means of the “+” and “-” controls, the number of
beats used in the averaging of the trend graphs.
Allows the user to measure the time interval between two points
on the screen. After the button is clicked, the user can start
dragging his finger from the start to the end point. The elapsed
time of the selected interval is shown on the display on the right
of this button.