Version date: 04 April 2016
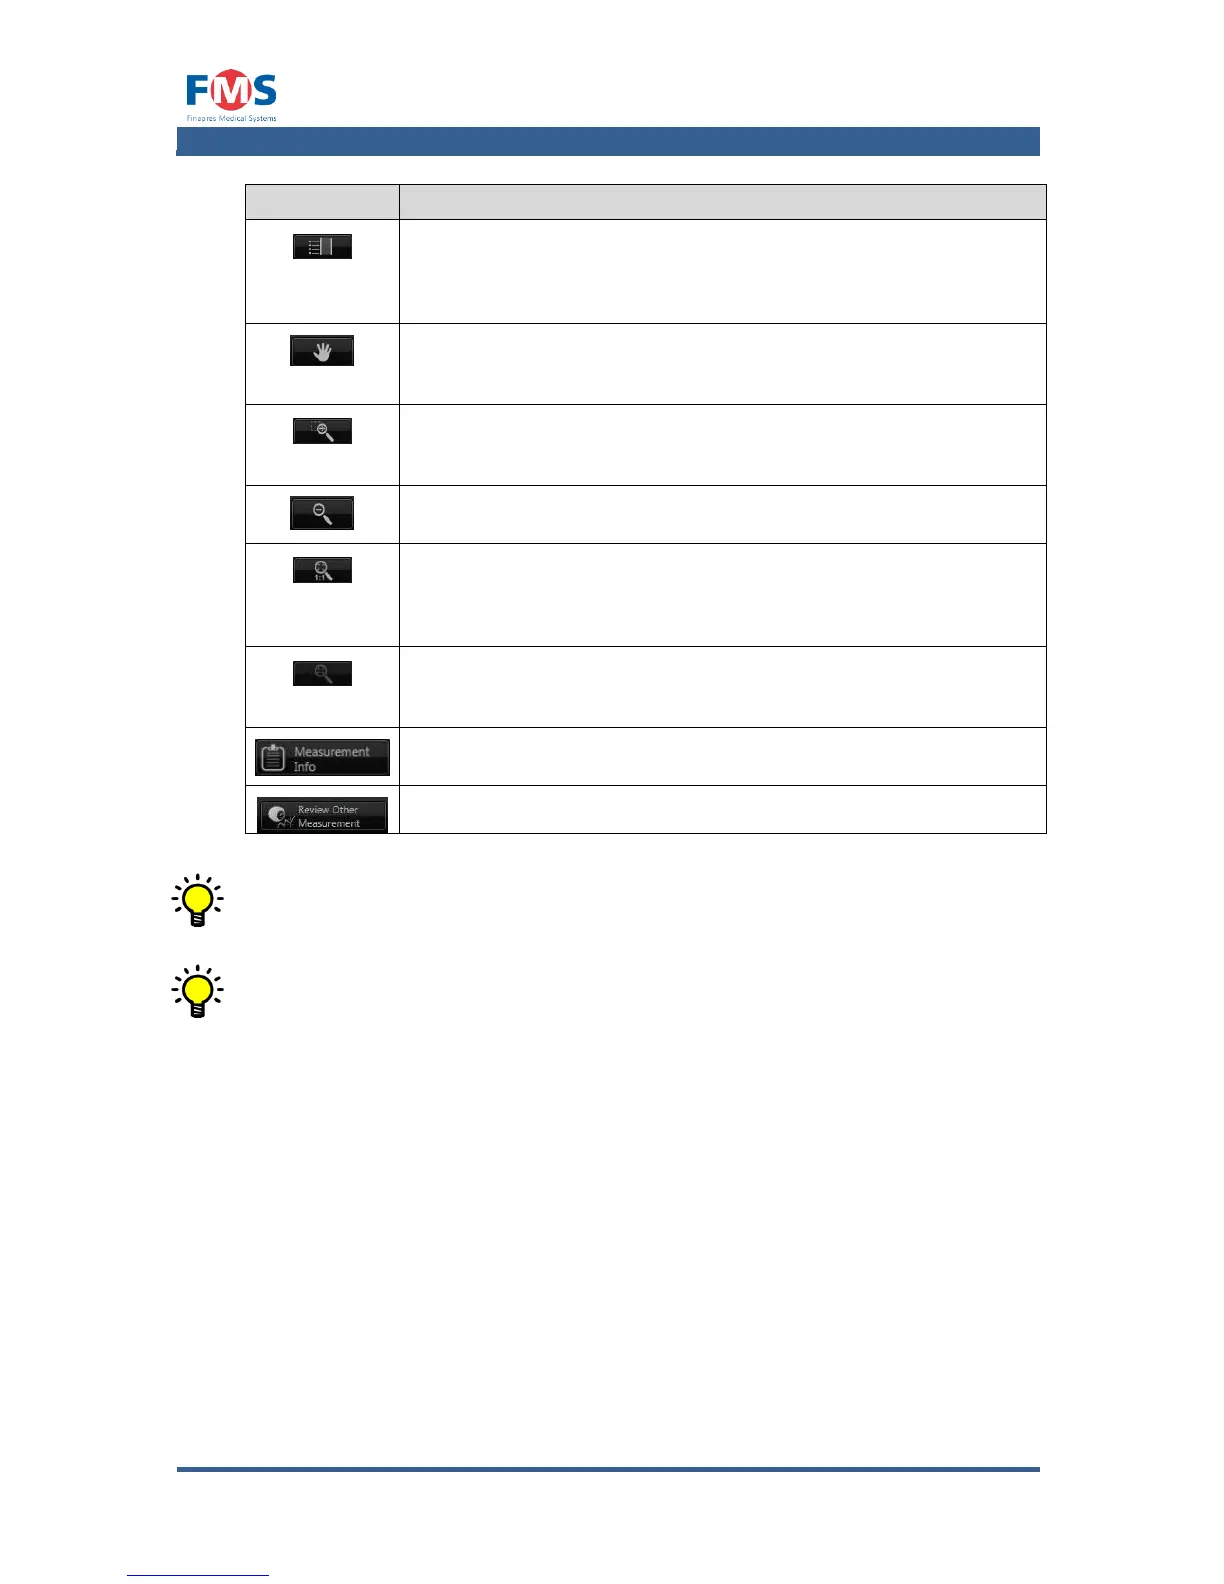
Shows a list of the highlights. Enables the user to alter the
highlight descriptions and to delete highlights. By means of the
button one can move quickly from highlight to highlight.
By clicking this button and subsequently dragging a finger over
the screen the user can move the graph to the left and right.
Enables to enlarge a certain part of the graph by dragging the
cursor over the graph.
Scales the image to the trace speed used during the
measurement. The graphs will have the same scaling as in the
“MEASUREMENTS” screen.
Shows the entire recording after subsequently clicking this button
and the graph.
Shows the patient data and measurement data.
Opens the file browser to select the next file to review.
All signals available during a measurement are stored. The showed signals
and graphs in the “REVIEW MEASUREMENT” screen can be altered by
means of the “MEASUREMENT SETTINGS” screen.
Screenshots are stored in the same directory as the recording and can be
downloaded as described in section 5.8 or using the network connection
A1.4.2 Manage user profiles
The “MANAGE USER PROFILES” screen displays the available user profiles. In the
right window a short summary of the details of the selected user profile is shown.