2-32 C70 CAPACITOR BANK PROTECTION AND CONTROL SYSTEM – INSTRUCTION MANUAL
SPECIFICATIONS CHAPTER 2: PRODUCT DESCRIPTION
2
TYPICAL LINK DISTANCE
CONNECTOR LOSSES (Total of both ends)
ST connector: 0.7 dB (each)
FIBER LOSSES
820 nm multimode: 3 dB/km
1300 nm multimode: 1 dB/km
1300 nm single mode: 0.35 dB/km
Splice losses: one splice every 2 km at 0.05 dB loss per splice
SYSTEM MARGIN
3 dB additional loss added to calculations to compensate for all other losses.
Compensated difference in transmitting and receiving (channel asymmetry) channel delays using GPS satellite clock: 10 ms
2.5.10 CyberSentry security
OPTIONS
Software options: Level 1
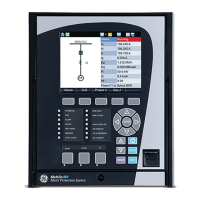
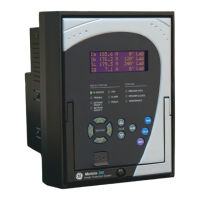
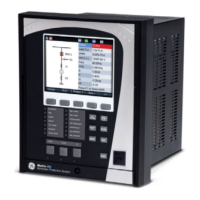
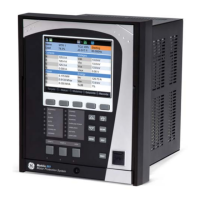
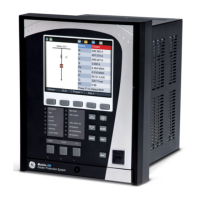
2.5.11 Graphical front panel
DISPLAY
Type: color graphical back-lit LCD display
Size: 7 inches (17.8 cm)
Resolution: 800 by 480 pixels
Pages: 5 single-line diagram pages with controls, status, and metering values
up to 8 annunciator pages with total of 96 annunciator windows
1 phasor metering page for each AC Source
5 tabular metering pages with dynamic metering and status
event records page with dynamic update
product information page
settings, actual values, error messages (targets)
The power budgets are calculated from the manufacturer’s worst-case transmitter power and worst case receiver
sensitivity.
The power budgets for the 1300 nm ELED are calculated from the manufacturer's transmitter power and receiver
sensitivity at ambient temperature. At extreme temperatures these values deviate based on component tolerance.
On average, the output power decreases as the temperature is increased by a factor of 1 dB / 5 °C.
Emitter, fiber type Cable type Connector
type
Typical distance
Before
January
2012
From
January
2012
820 nm LED,
multimode
62.5/125 μm ST 1.65 km 2 km
50/125 μm ST 1.65 km 2 km
1300 nm LED,
multimode
62.5/125 μm ST 4 km 5 km
50/125 μm ST 4 km 5 km
Typical distances listed are based on the following assumptions for system loss. As actual losses vary from one
installation to another, the distance covered by your system can vary.