G-858BP Backpack Mag Operators Manual
Viewing Data
Data profiles may be reviewed by pressing the CHART (-) key. The arrow keys will scroll
through the data. Pressing the SCALE or MENU keys will allow you to adjust the scale.
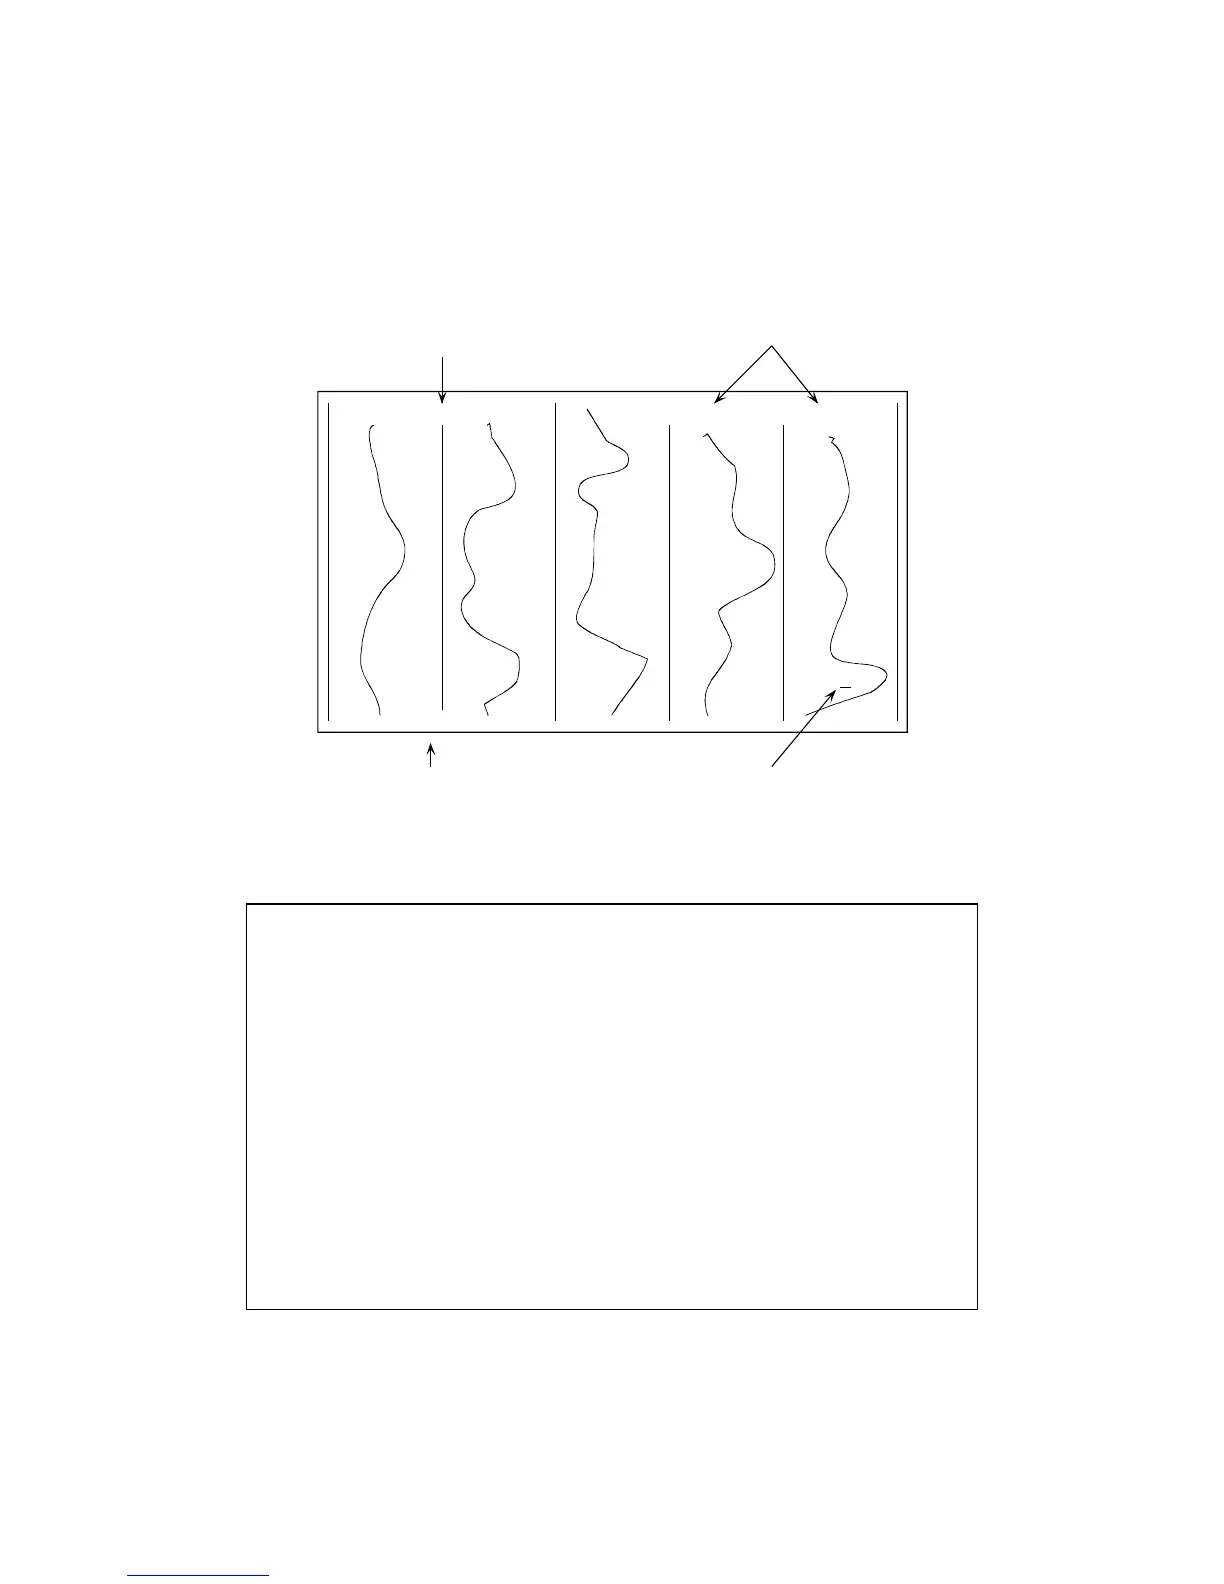
Each line is plotted in its own lane. Values “wrap around” inside the lane. The scale may be set
by pressing the scale key, or by pressing menu and bringing up the Chart adjust menu.
The chart display is shown below.
100.00
0.00
0.00, 50.00
Coordinate of top of display
Cursor x,y coordinate
Coordinate of bottom of display Cursor
Chart Display for Mapped Survey.
Pressing the MENU key will bring up the data review menu:
--- DATA REVIEW MENU ---
Move to position:
X = [ 80.00 ]
Y = [ 100.00 ]
Full scale: < 2 > nT
Zoom to show < ALL > of line
Move to position
This will jump the cursor to a particular position, and scroll the data to that point. This is useful to
rapidly page back to a particular point, without having to scroll through the entire file.
Full scale:
54
 Loading...