The StellarMate Plus Manual
188 / 341
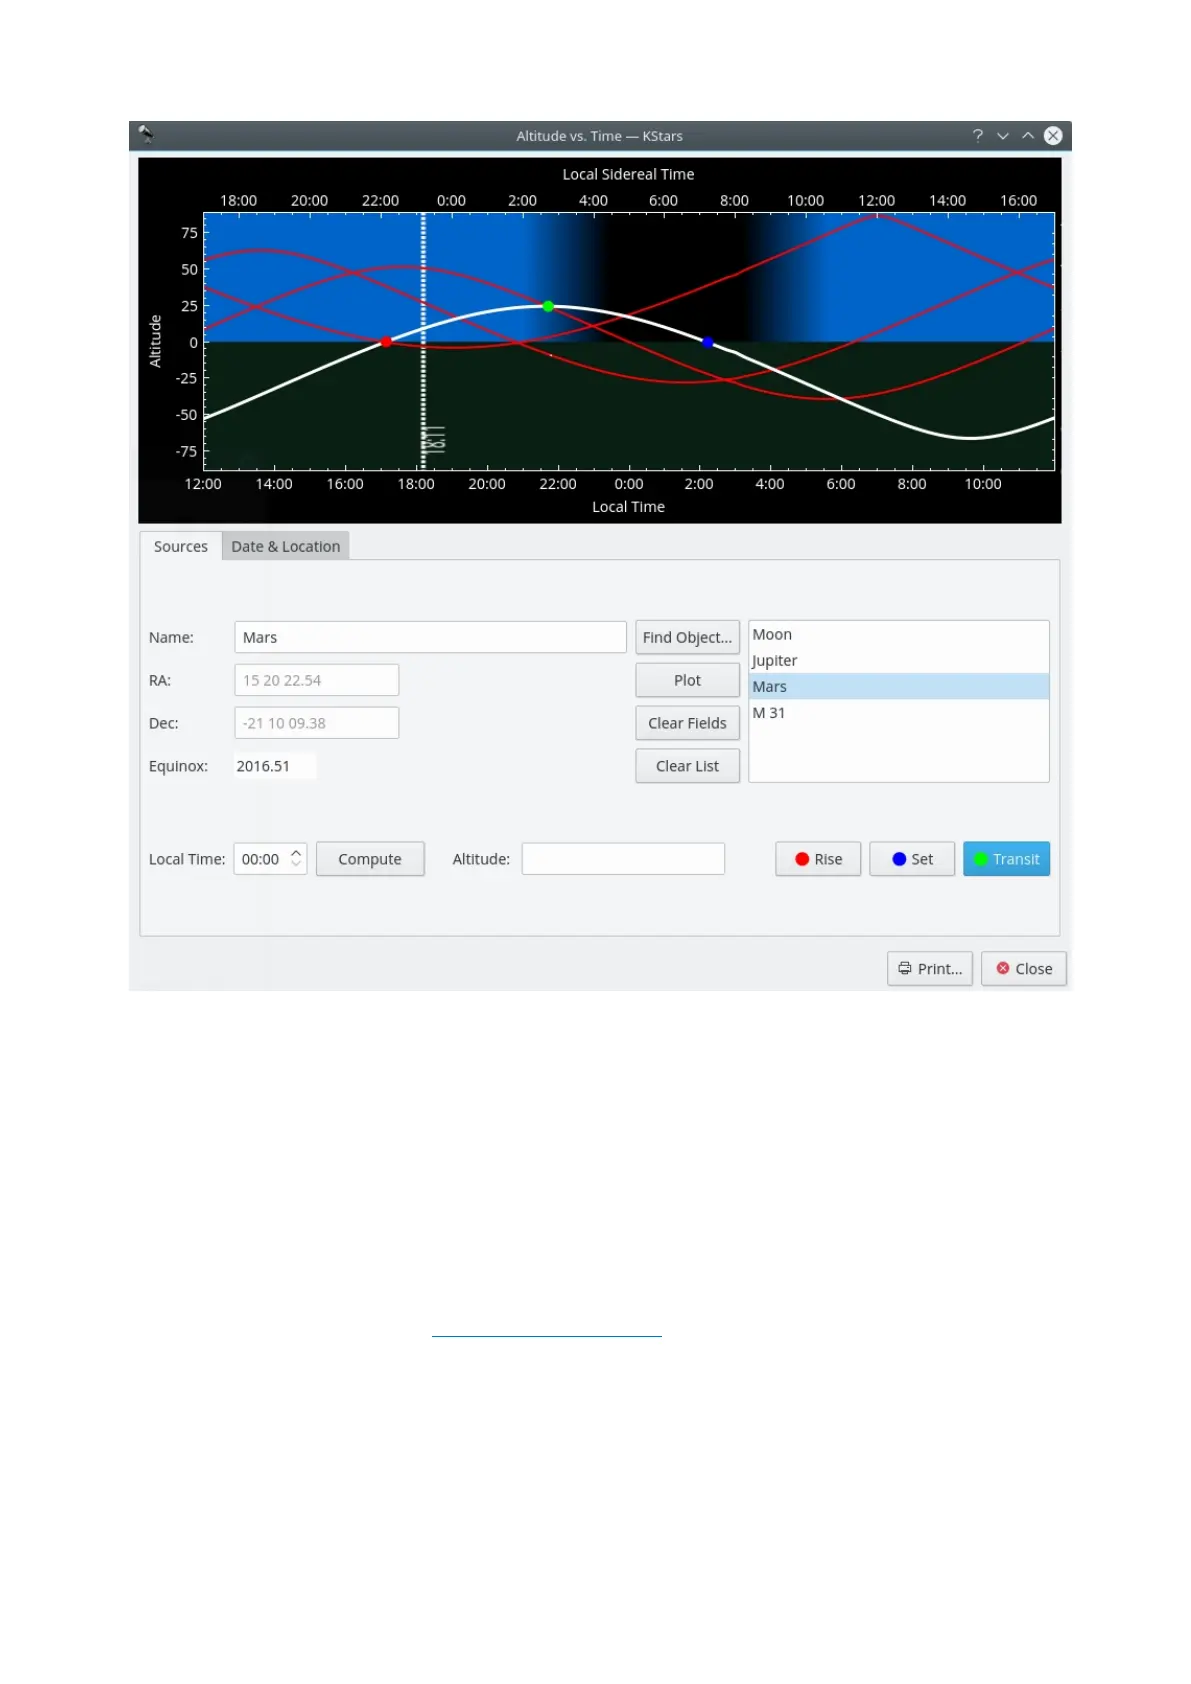
This tool plots the altitude of any objects as a function of time, for any date and
location on Earth. The top section is a graphical plot of altitude angle on the
vertical axis, and time on the horizontal axis. The time is shown both as standard
local time along the bottom, and sidereal time along the top. The bottom half of
the graph is shaded green to indicate that points in this region are below the
horizon.
There are a few ways to add curves to the plot. The simplest way to add the
curve of an existing object is to simply type its name in the Name input field, and
press Enter, or the Plot button. If the text you enter is found in the object
database, the object's curve is added to the graph. You can also press the Find
Object button to open the Find Object Window to select an object from the list of
known objects. If you want to add a point that does not exist in the object
database, simply enter a name for the point, and then fill in the coordinates in
the RA and Dec input fields. Then press the Plot button to add the curve for your
custom object to the plot (note that you have to pick a name that does not
already exist in the object database for this to work).
When you add an object to the plot, its altitude vs. time curve is plotted with a