92
Explanation
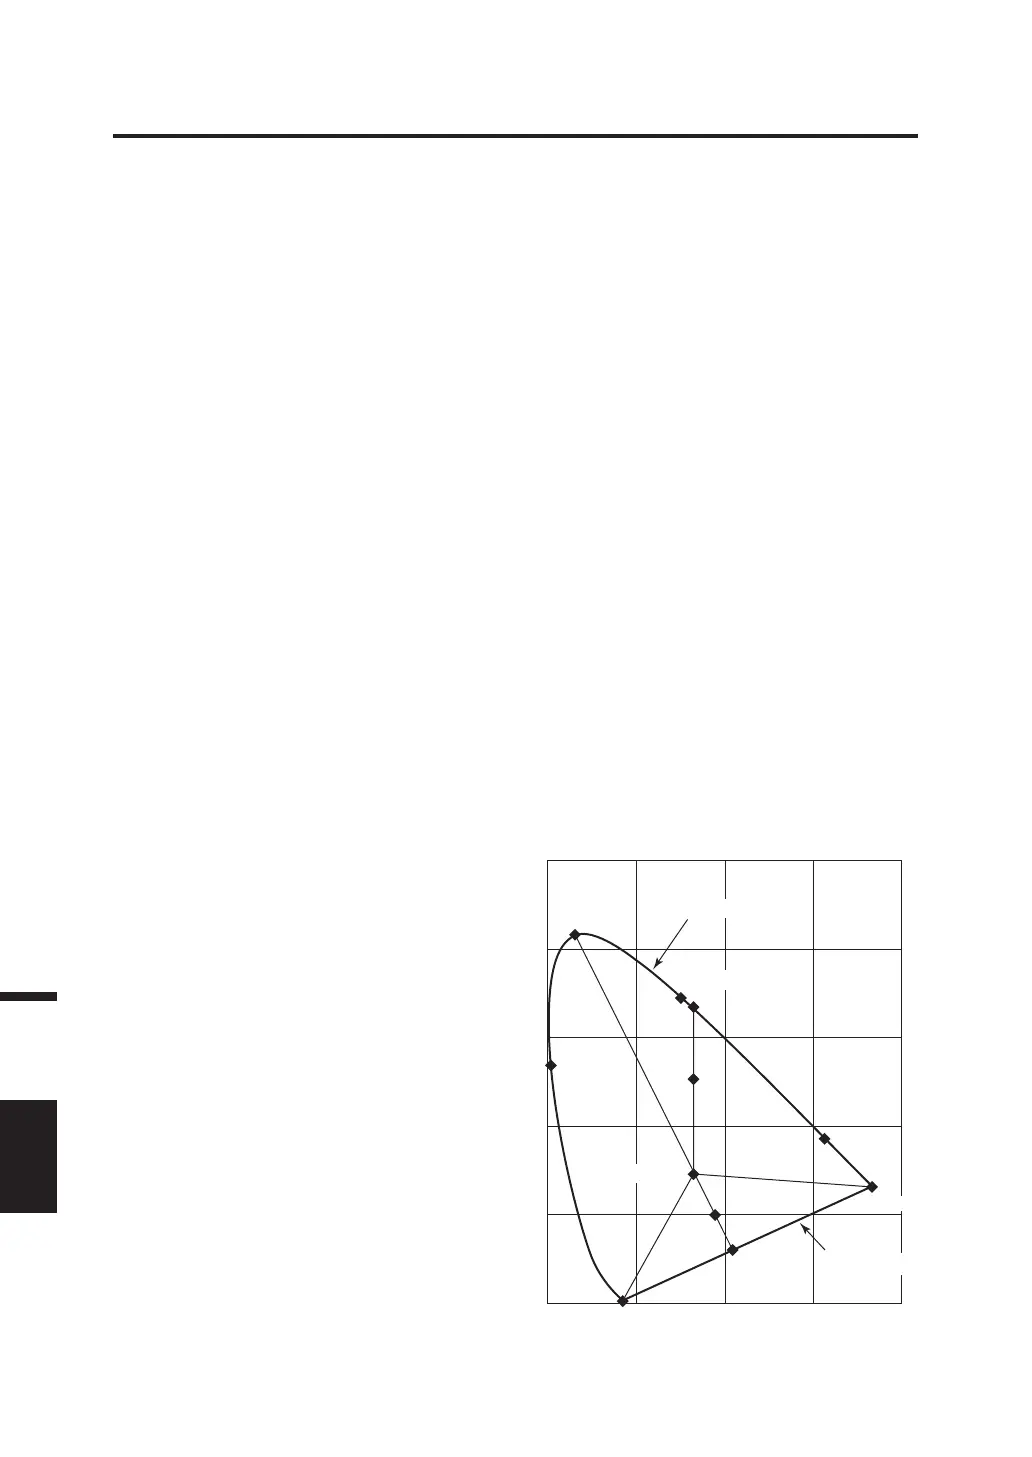
In the x, y chromaticity diagram shown below, the curve VS
c
SR is the spectrum locus, and point N is the
white point.
Colors located in the region enclosed by the spectrum locus and the straight lines VN and NR are
referred to as spectral colors; colors located in the triangle NVR with the white point N at the apex and
the pure-purple locus VR as the base are referred to as non-spectral colors.
<Dominant wavelength and excitation purity (spectral colors)>
When the chromaticity point obtained by the measurement is C, the wavelength corresponding to the
intersection point S of the extension of NC with the spectrum locus (curve VS
c
SR) is referred to as the
dominant wavelength and indicated by the symbol λ
d
.
The ratio of the lengths of the straight lines NC and NS is referred to as the excitation purity of color
excitation C and indicated by the symbol p
e
.
<Complementary wavelength (non-spectral colors)>
When the chromaticity point obtained by measurement is C’, the extension of NC’ toward C’ does not
intersect with the spectrum locus but only the pure-purple locus. In this case, the wavelength
corresponding to the intersection point S
c
of the extension of NC’ toward N with the spectrum locus is
referred to as the complementary wavelength and indicated by the symbol λ
c
.
When the intersection point of the extension of the line NC’ with the line VR (pure-purple locus) is
designated by S’, the ratio of the lengths of NC’ to NS’ is referred to as excitation purity of color
excitation C’ and indicated by the symbol p’
v
.
The following equations are formulated, if each point is designated as the following coordinates:
(x
n
, y
n
): chromaticity coordinate of point N;
(x
c
, y
c
): chromaticity coordinate of point C;
(x
λ
, y
λ
): chromaticity coordinate of point S;
(x
c’
, y
c
’): chromaticity coordinate of point C’;
and (x
p
, y
p
): chromaticity coordinate of point P:
Excitation purity (spectral colors)
x
c
– x
n
y
c
– y
n
p
e
=
–
=
–
x
λ
– x
n
y
λ
– y
n
Excitation purity (non-spectral colors)
x
c
’– x
n
y
c
’ – y
n
p
e
’ =
–
=
–
x
p
– x
n
y
p
– y
n
Dominant Wavelength/Excitation Purity
Dominant wavelength on chromaticity diagram
y
0
0.2 0.4 0.6
x
550 nm
600 nm
780 nm
500 nm
380 nm
S
S
c
C
C'
S'
N
V
Spectrum locus
locus
White point
R
 Loading...