32 EC-30C | 1.00.02 +49 2102 935 888 www.mc-techgroup.com
7.8 Temperature diagrams
The EC-30C shows the temperature diagrams of the pre-cooling unit and the two
deep-cooling units. The temperature diagrams display a time period of 6 hours.
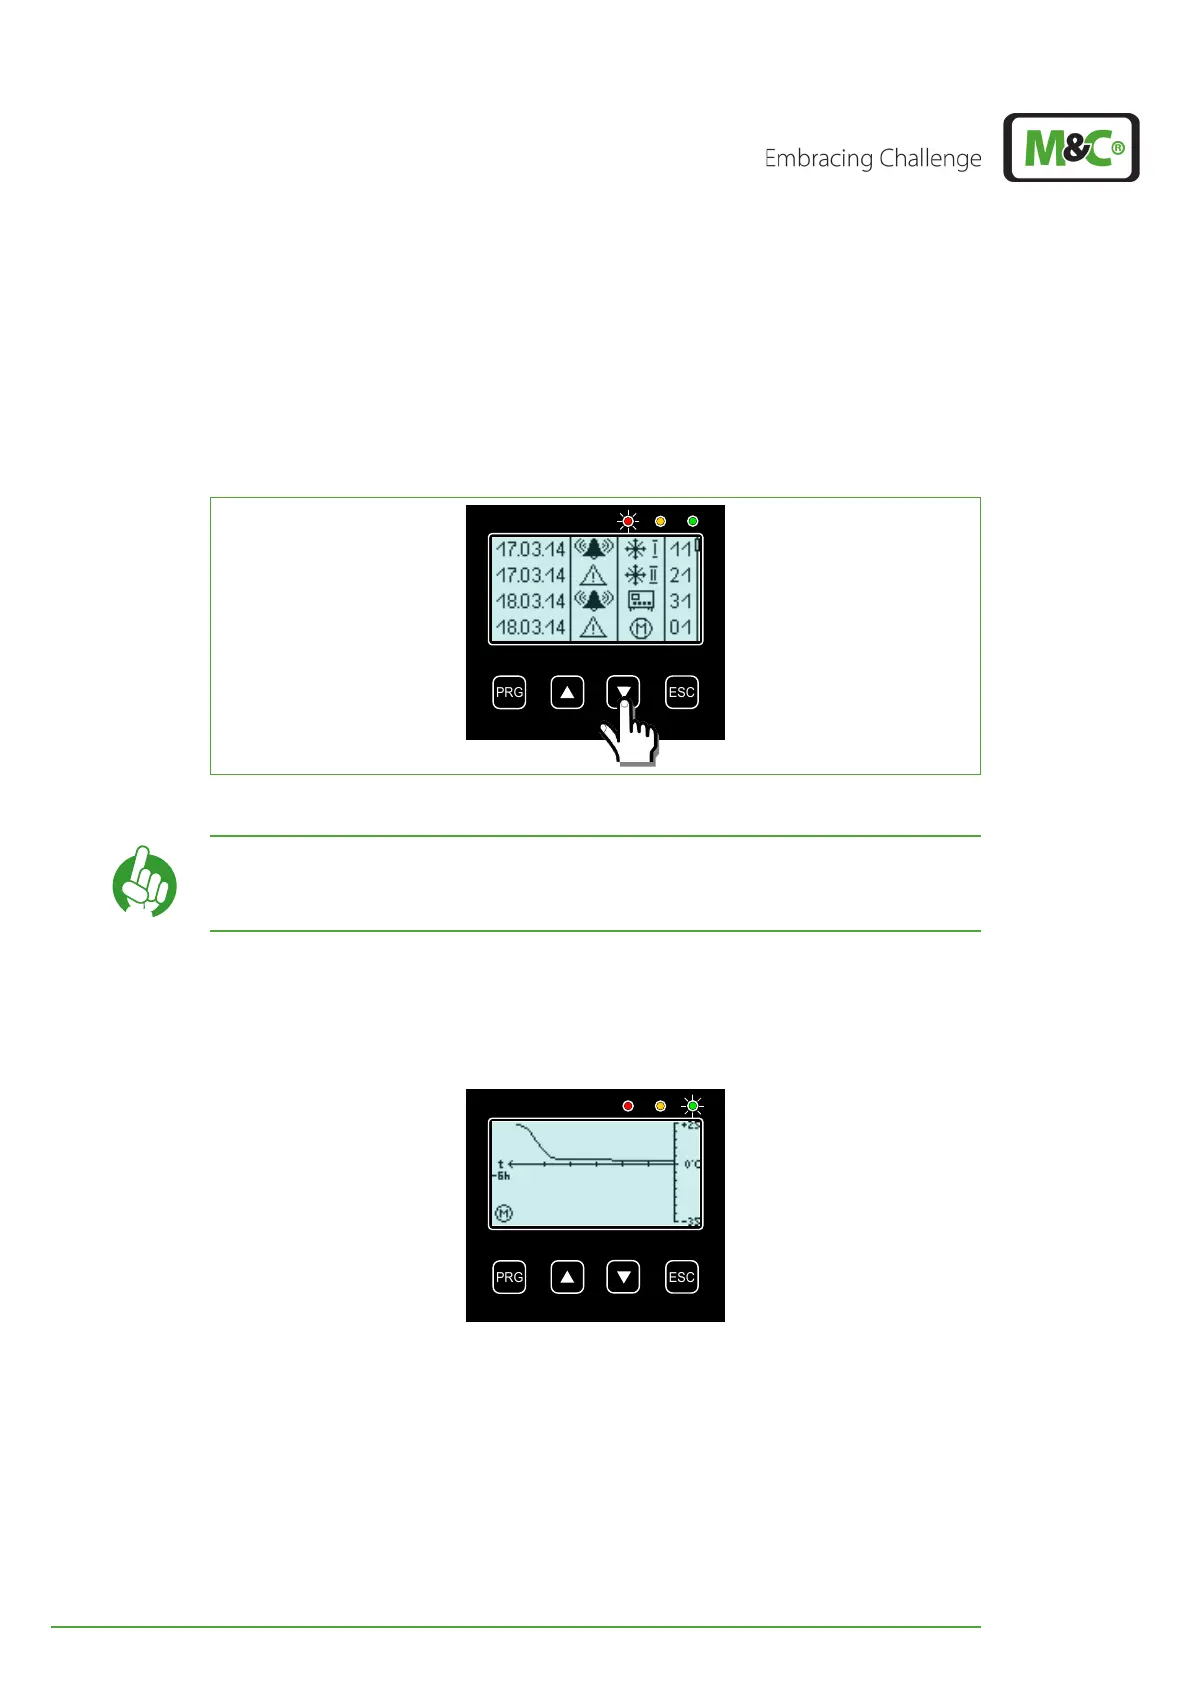
You can reach the temperature diagrams from the alarm and warning history screen by
pressing the DOWN button.
Fig. 19: How to reach the graphical temperature diagrams
Note
With the UP and DOWN buttons you can switch between the
graphical temperature diagrams of the pre-cooling unit and the two
deep-cooling units.
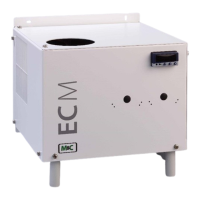
7.8.1 Diagram of the pre-cooler unit (PCU)
You can reach the temperature diagram of the pre-cooler unit (PCU) from the alarm and
warning history screen by pressing the DOWN button.
Fig. 20: Temperature diagram of the pre-cooling unit
After the commissioning of the EC-30C, the temperature diagram starts adding measure-
ment readings from right to left. Every three minutes the characteristic line is updated with
a new temperature value. The diagram always shows the measured temperature of the
last 6 hours. Temperature values older than 6 hours will be deleted.
The y-axis of the PCU temperature diagram shows a temperature range from -35 °C to +25
°C (~-31 °F to +77 °F). Measured values exceeding or going below this temperature range
will not be displayed.