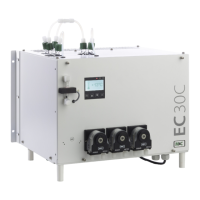
EC-30C | 1.00.02 +49 2102 935 888 www.mc-techgroup.com 33
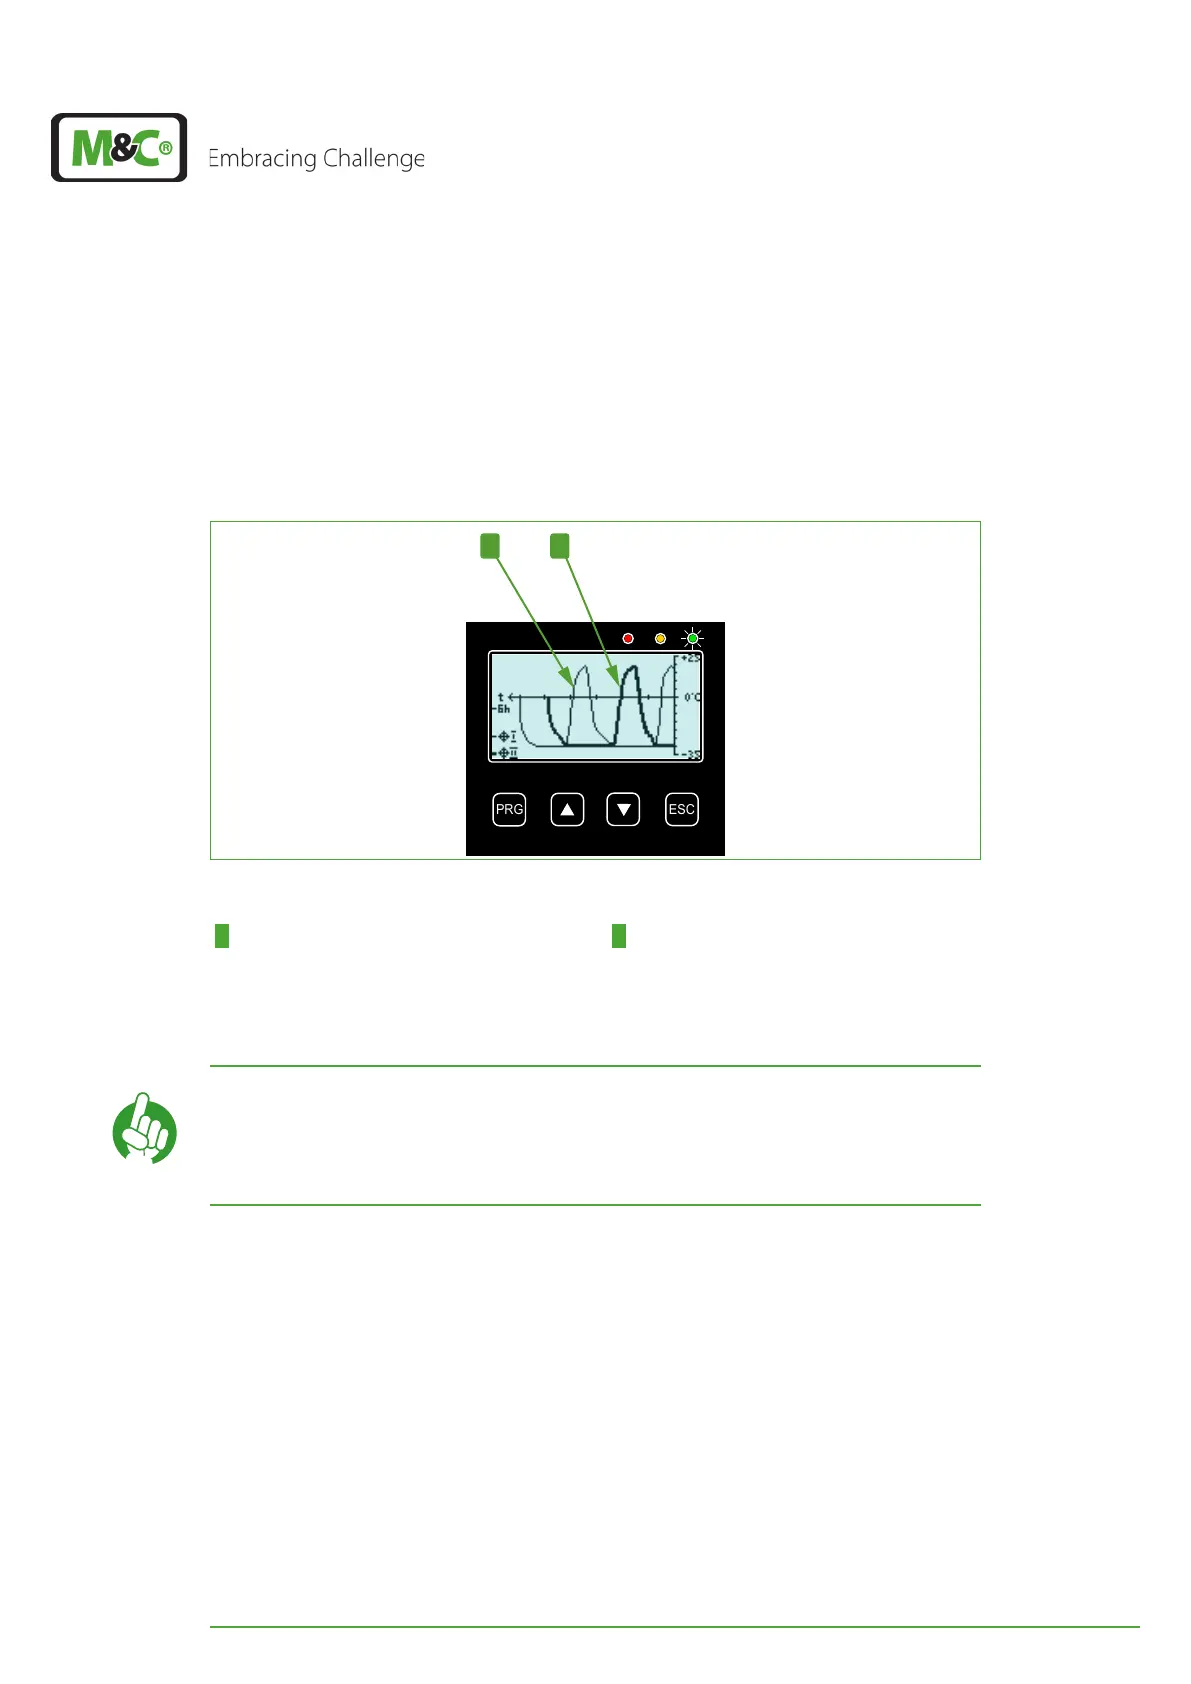
7.8. 2 Diagram of the deep cooling units (DCU 1 and DCU 2)
Starting from the pre-cooling unit (PCU) temperature diagram screen, please press the
DOWN button to reach the temperature diagram of the two deep-cooling units. Here
both deep-cooling units are displayed in one diagram.
The fine line shows the temperature characteristic of DCU 1 and the thicker line shows the
characteristic of DCU 2.
1 2
Fig. 21: Temperature diagram of the deep-cooling units
1 Diagram of DCU 1 2 Diagram of DCU 2
The temperature range of the y-axis is limited from -35 °C to +25 °C (~-31 °F to +77 °F).
Measured values exceeding or going below this temperature range will not be displayed.
Note
Broken temperature lines are caused by switching the unit off and on
again.
When the EC-30C is turned off, and for excample after 2 hours turned
on again, the temperature of the deep-cooling units will have
changed. This leads to a broken line in the diagram.