■■■■■■■■■■■■■■■■■■■■■■
5 Operation
899 Coulometer
■■■■■■■■
51
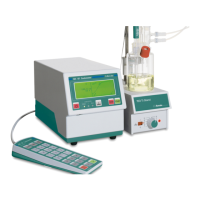
The arrow keys [⇦] and [⇨] can be used to move to the individual measur-
ing points. A cross hair is used to show the current position on the curve.
The data (water quantity, measured value, time, etc.) for the respective
measuring point is indicated on the right-hand side.
Recalculating
NOTE
Recalculation cannot be undone.
All of the results are recalculated with the Recalculate function. This is
necessary if, for example, the calculation or the sample size has been
modified.
5.11 Statistics
Menu ▶ Results ▶ Statistics
The statistical overview of a determination series can be displayed in the
Results dialog with the Statistics function.
NOTE
This function is visible only if statistics has been activated.
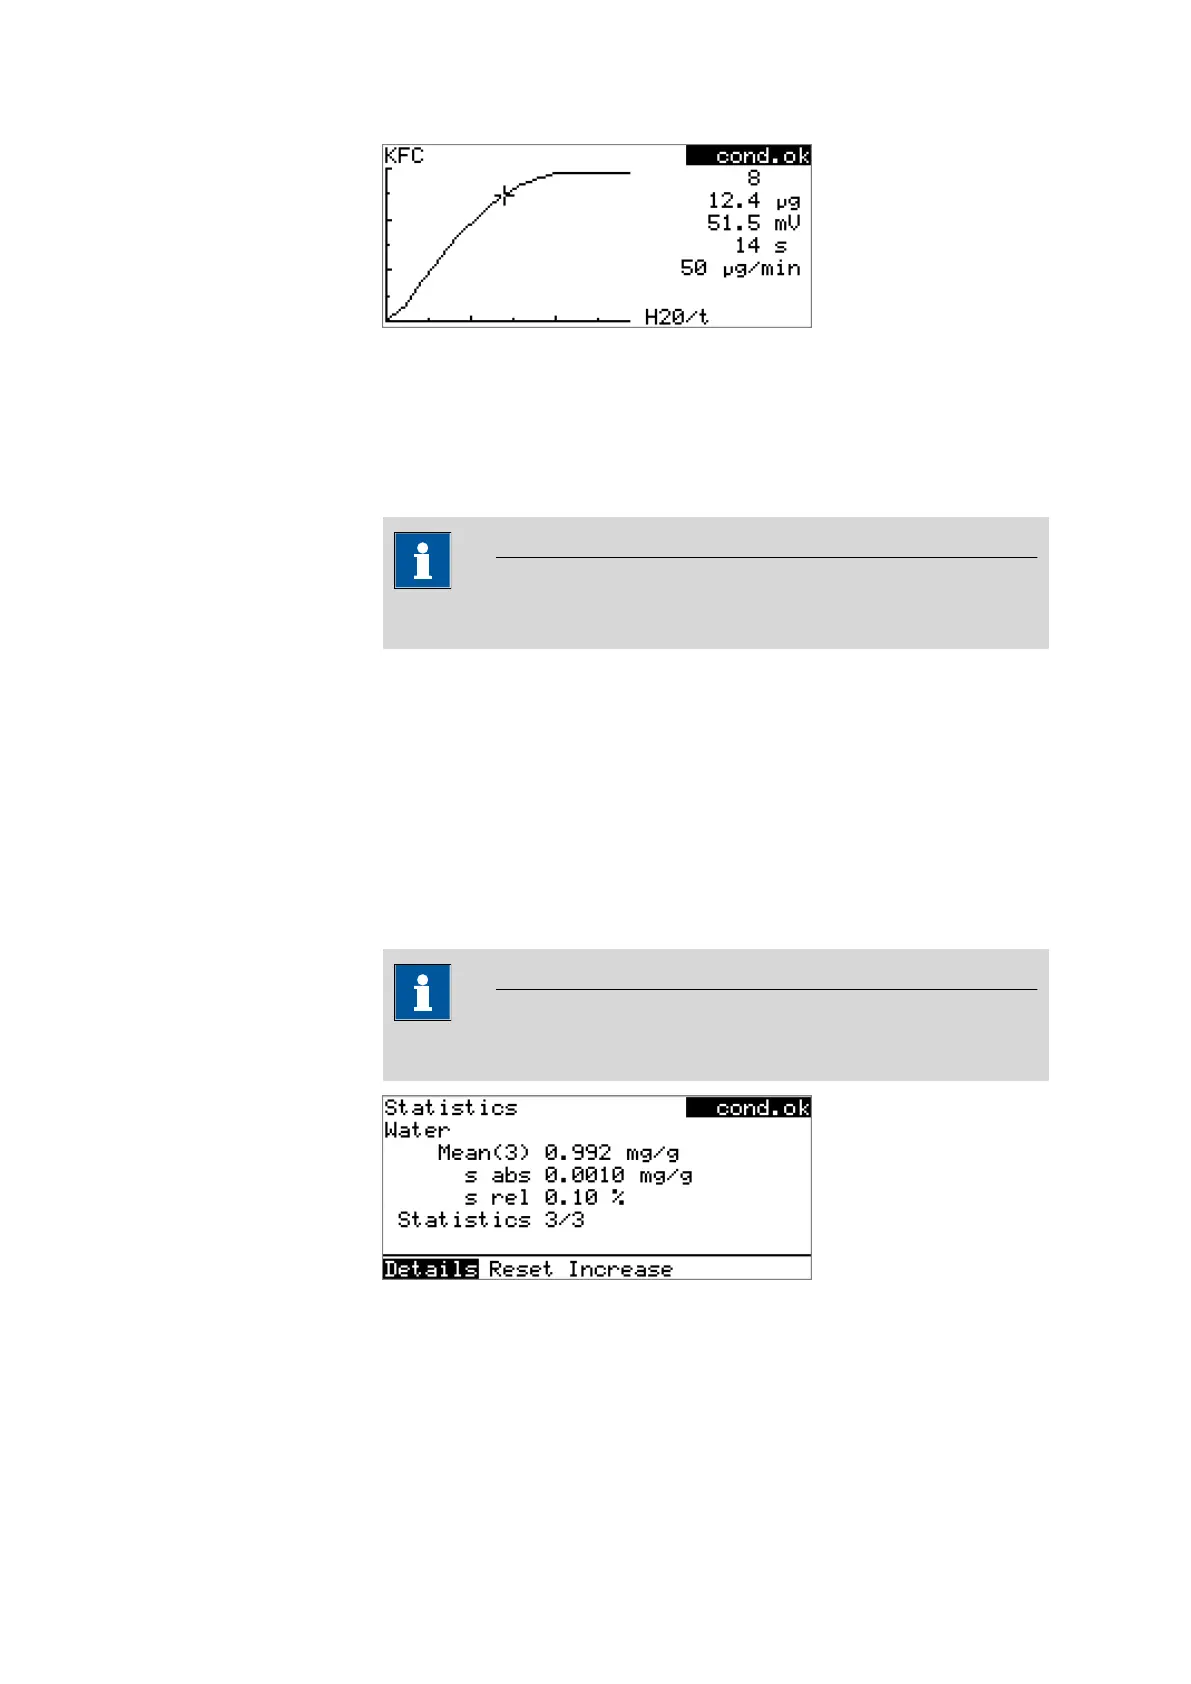
The mean value (Mean), the absolute and the relative standard deviation
(s abs and s rel) are displayed in the overview. For the mean value, the
number of individual results from which it has been calculated is displayed
in parentheses. In this example, it is 3. The Statistics line shows how
many determinations have already been carried out and how many deter-