EasyManuals Logo

Newport LBP2 Series User Manual

Newport LBP2 Series
103 pages
To Next Page IconTo Next Page
To Previous Page IconTo Previous Page
Page #94 background imageLoading...
Page #94 background image
LBP2 User Guide Document No: 50306-001 Rev G 3/12/2020 Page 94
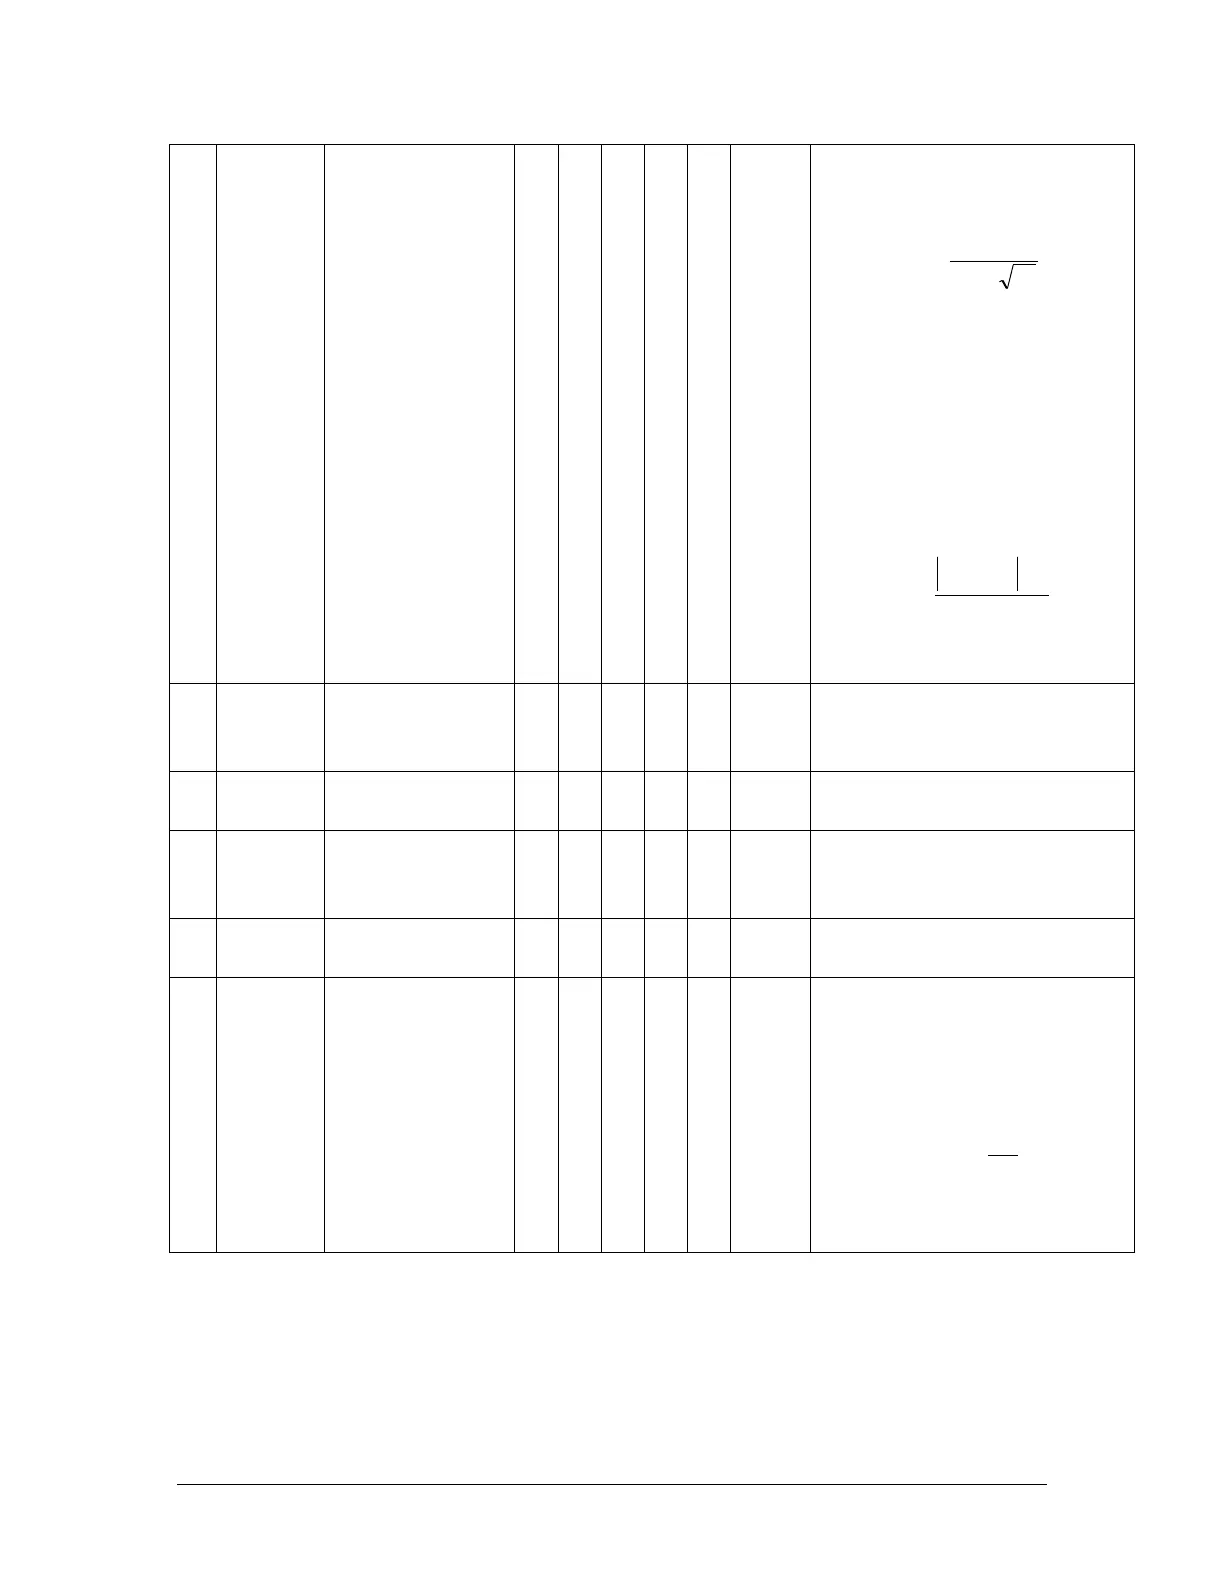
the fit between measured
and theoretical distributions.
goodness of fit:
N
G
1
1
where: N is the total number of
data points in the measured
distribution,
is the maximum
deviation between measured
and theoretical distributions of
apertured powers/energies
truncated at
10n
random
locations
),(
ji
yx
in the
distribution:
P
PP
f
ijij
max
Note:
10 G
, as
0G
the
quality of the fit becomes better.
48
d
x
, d
y
grid spacing
2
3.1
Partition of detector area
into orthogonal grid of
apertures.
49
A
ij
area of sub-
aperture
2
3.2
Area of a sub-aperture may
be either square or round.
50
L
H
focal length
2
3.3
Distance from the sub-
aperture screen to the
detector array.
51
d
p
pinhole
diameter
2
3.5
Diameter of the holes in a
Hartmann screen
52
N
Fr
Fresnel number
2
3.6
The ratio of the pinhole
spacing to the radius of the
projected spot on the
detector.
Fresnel number:
ij
x
Fr
d
N
ρ
ij
= radius of the projected
spot

Table of Contents

Questions and Answers:

Question and Answer IconNeed help?

Do you have a question about the Newport LBP2 Series and is the answer not in the manual?

Newport LBP2 Series Specifications

General IconGeneral
BrandNewport
ModelLBP2 Series
CategoryMeasuring Instruments
LanguageEnglish

Related product manuals