50
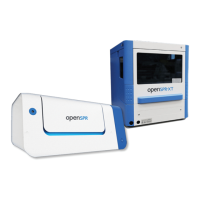
Uncheck irrelevant curves in overlay clone. Here, only analyte and reference curves are checked
[Figure 3.7].
Figure 3.7 - Overlay clone with only binding and reference curves checked on right side of window.
5. Zoom in
a. Right click on plot and press Zoom to extents to center the entire plot
b. Left click and drag a rectangle to zoom in on a specific region of the plot
6. Move curves
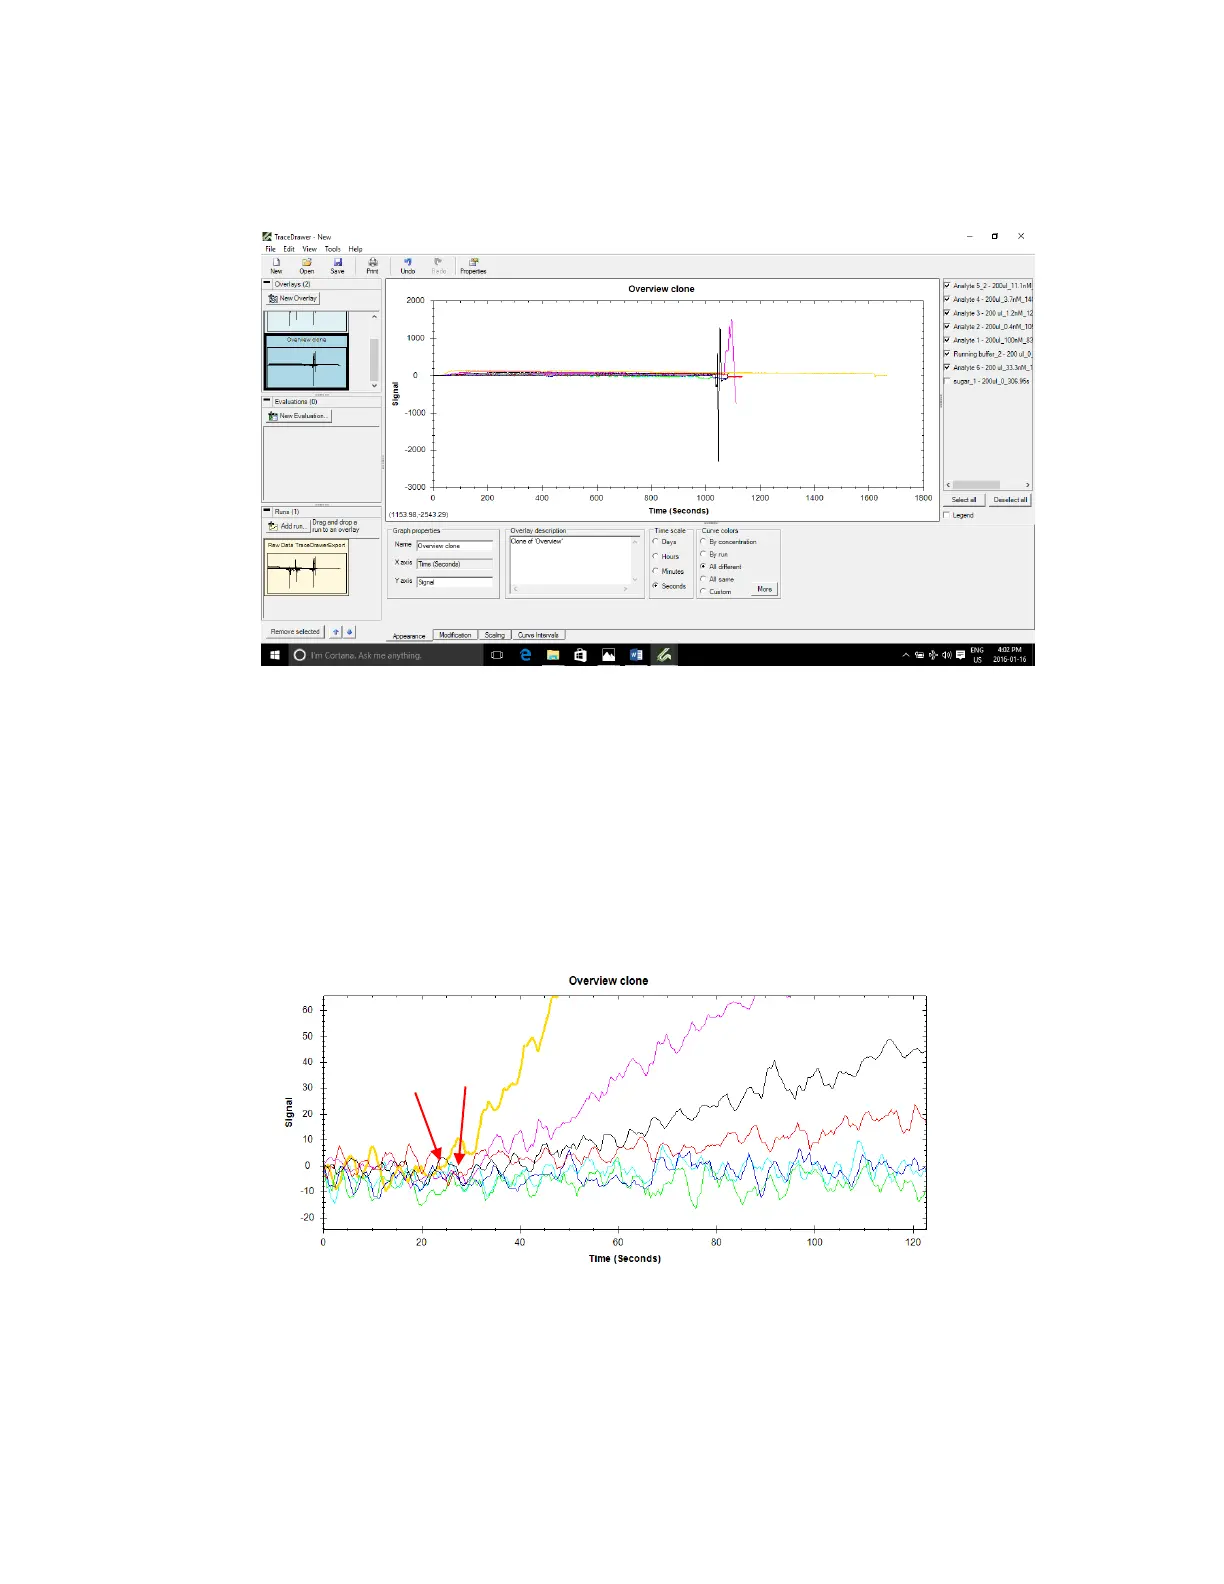
As shown in the zoomed in example plot below, the start of concentration change for the orange
curve appears to be slightly earlier than the rest of the curves [Figure 3.8].
Figure 3.8 - Example plot where concentration change of orange curve begins before other curves, indicated by arrows.
Left click to highlight/select curve(s) to be moved. Click Curve move in the Modification tab
(located at bottom of the screen) and enter change in x or/and y values to align all of the curves
[Figure 3.9]. Apply change(s).