51
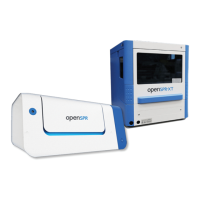
Figure 3.9 - Within modification tab, select move curve option to shift the position of selected curves.
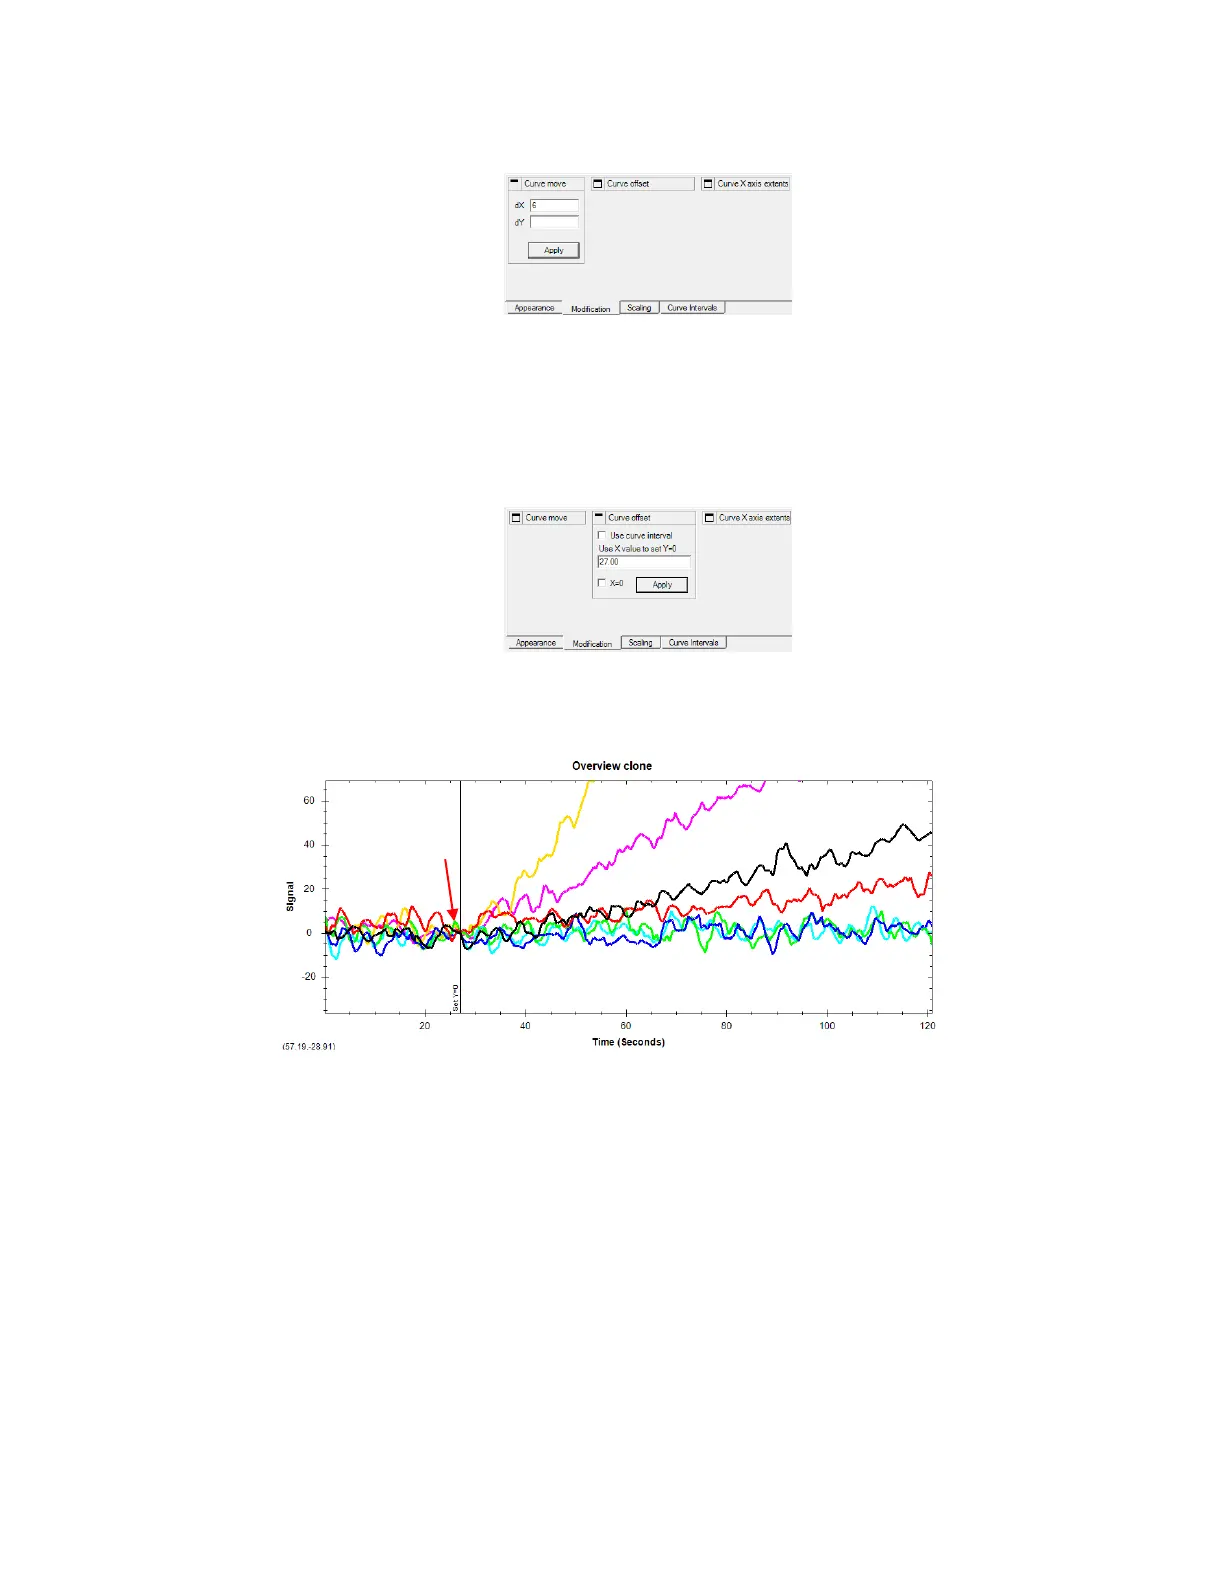
Once the curves are aligned in x, it is also recommended to set the beginning of the curves to Y=0.
Select all curves. Click Curve offset in Modification tab and position the bar at the x-value where
the curves start (or simply enter this x-value). Click Apply to set Y=0 at this point. [Figure 3.10].
Figure 3.10 - Select all curves and within Curve Offset menu in Modification tab, enter x-value to set Y=0.
Resulting plot after applying both alignments is shown below [Figure 3.11].
Figure 3.11 - Example binding curves after applying Curve move and Curve offset alignments. Note how the beginning of each
binding curve is aligned in X and Y.
7. Crop the curves at the boundaries
In this example, analyte and reference curves are cropped to equal lengths (900s). This will also
help remove irregular signal at the end boundary. Select analyte curve(s) and go to Modification
tab. Select Curve X axis extents, enter start and end values and click Apply [Figure 3.12].