Technical Data
87
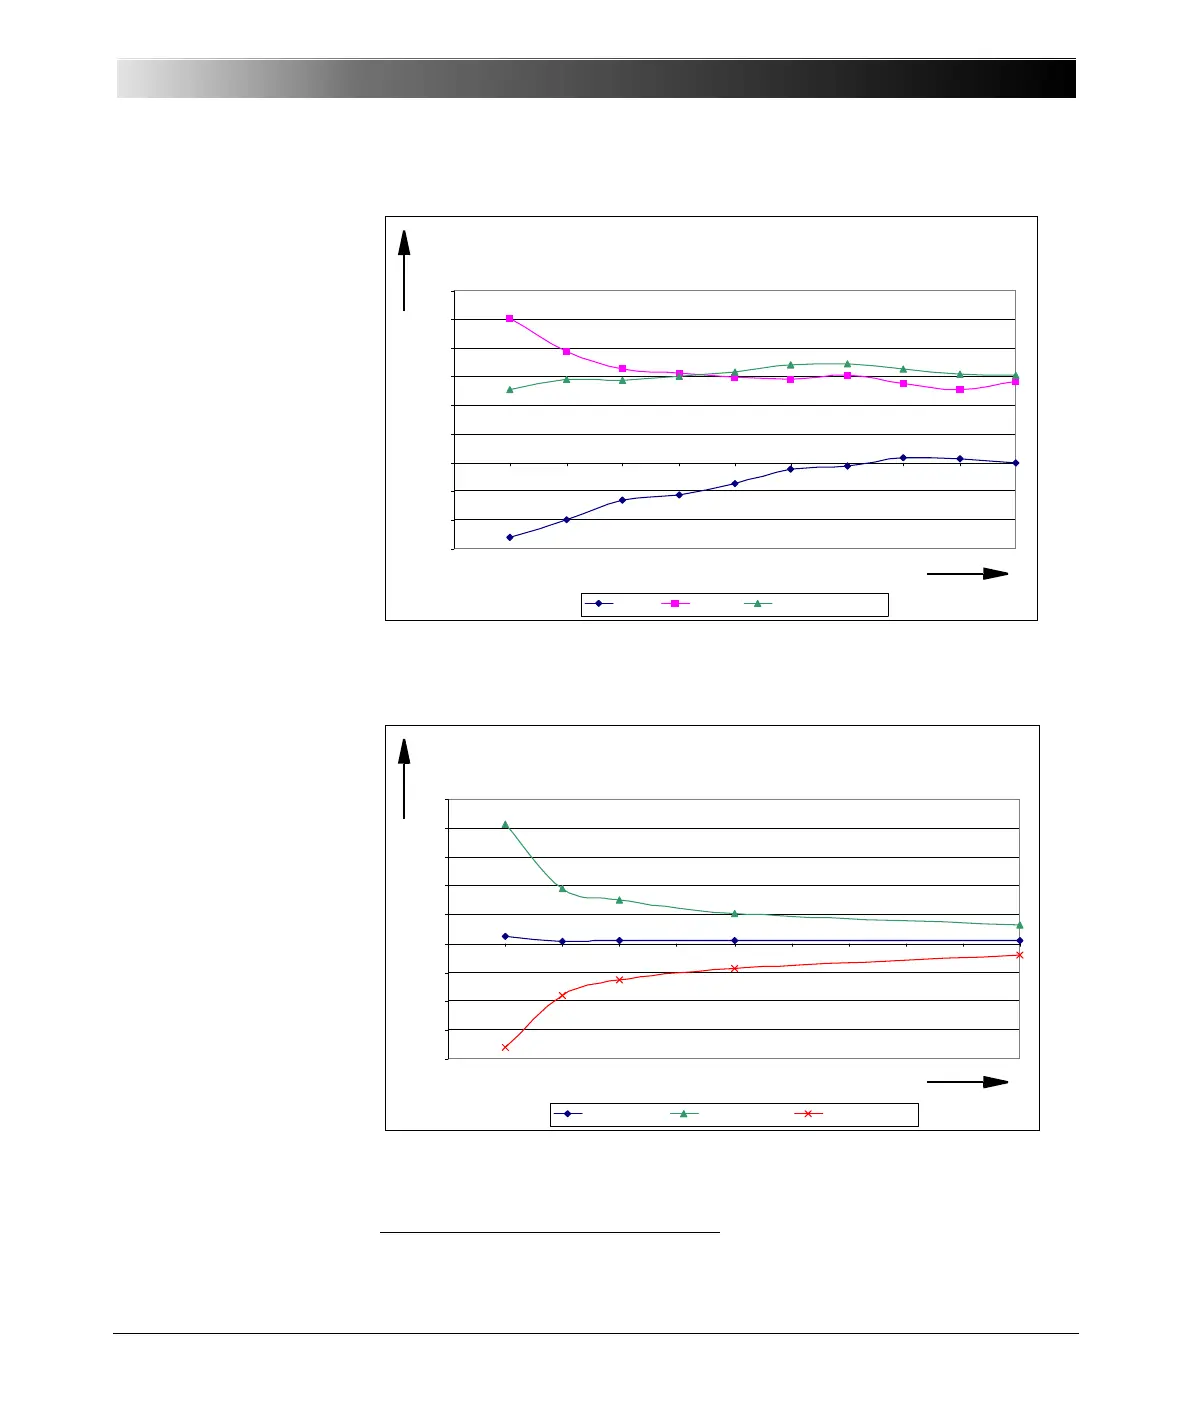
Figure 6-29:
Typical error of the
reactive power Q as a
function of the excitation,
fs = 28.44 kHz, fin = 50 Hz
Conditions: integration time 1s, measurement signal sinusoid, sampling
rate = 28.44 kHz, fin = 50 Hz
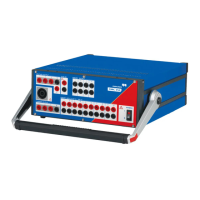
Figure 6-30:
Typical error
1
of the
reactive power Q as a
function of the phase shift
considering the apparent
power, fs = 28.44 kHz,
fin = 50 Hz, excitation
CH1 and CH2 = 70 %.
1
Conditions: integration time 1s, measurement signal sinusoidal, sampling
rate = 28.44 kHz, both channels with same excitation 70 %
Typ. Error reactive pow er Q as a function of the excitation
(fs = 28.44kHz, f=50Hz)
-0,15
-0,1
-0,05
0
0,05
0,1
0,15
0,2
0,25
0,3
0 10 2030405060 7080 90100
Excitation CH1&CH2 / %
Rel. Error / %
phi = 1° phi = 60° cos phi=0.01 (89.4°)
Typical error of reactive power Q as function of the excitation
(fs = 28.44 kHz, f = 50 Hz)
Rel. error in %
Excitation CH1 & CH2 in %
1
The 3Sigma values are determined from 50 measurement values.
Typ. Error reactive power Q as a function of the phase shift
(fs = 28.44kHz, f = 50HZ)
-0,4
-0,3
-0,2
-0,1
0
0,1
0,2
0,3
0,4
0,5
0 0,1 0,2 0,3 0,4 0,5 0,6 0,7 0,8 0,9 1
Phas e / °
Rel. Error / %
Average Error Error (+3sigma) Er r o r ( - 3 s ig m a)
Typical error of reactive power Q as function of the phase shift
(fs = 28.44 kHz, f = 50 Hz)
Rel. error in %
Phase shift in °