Technical Data
93
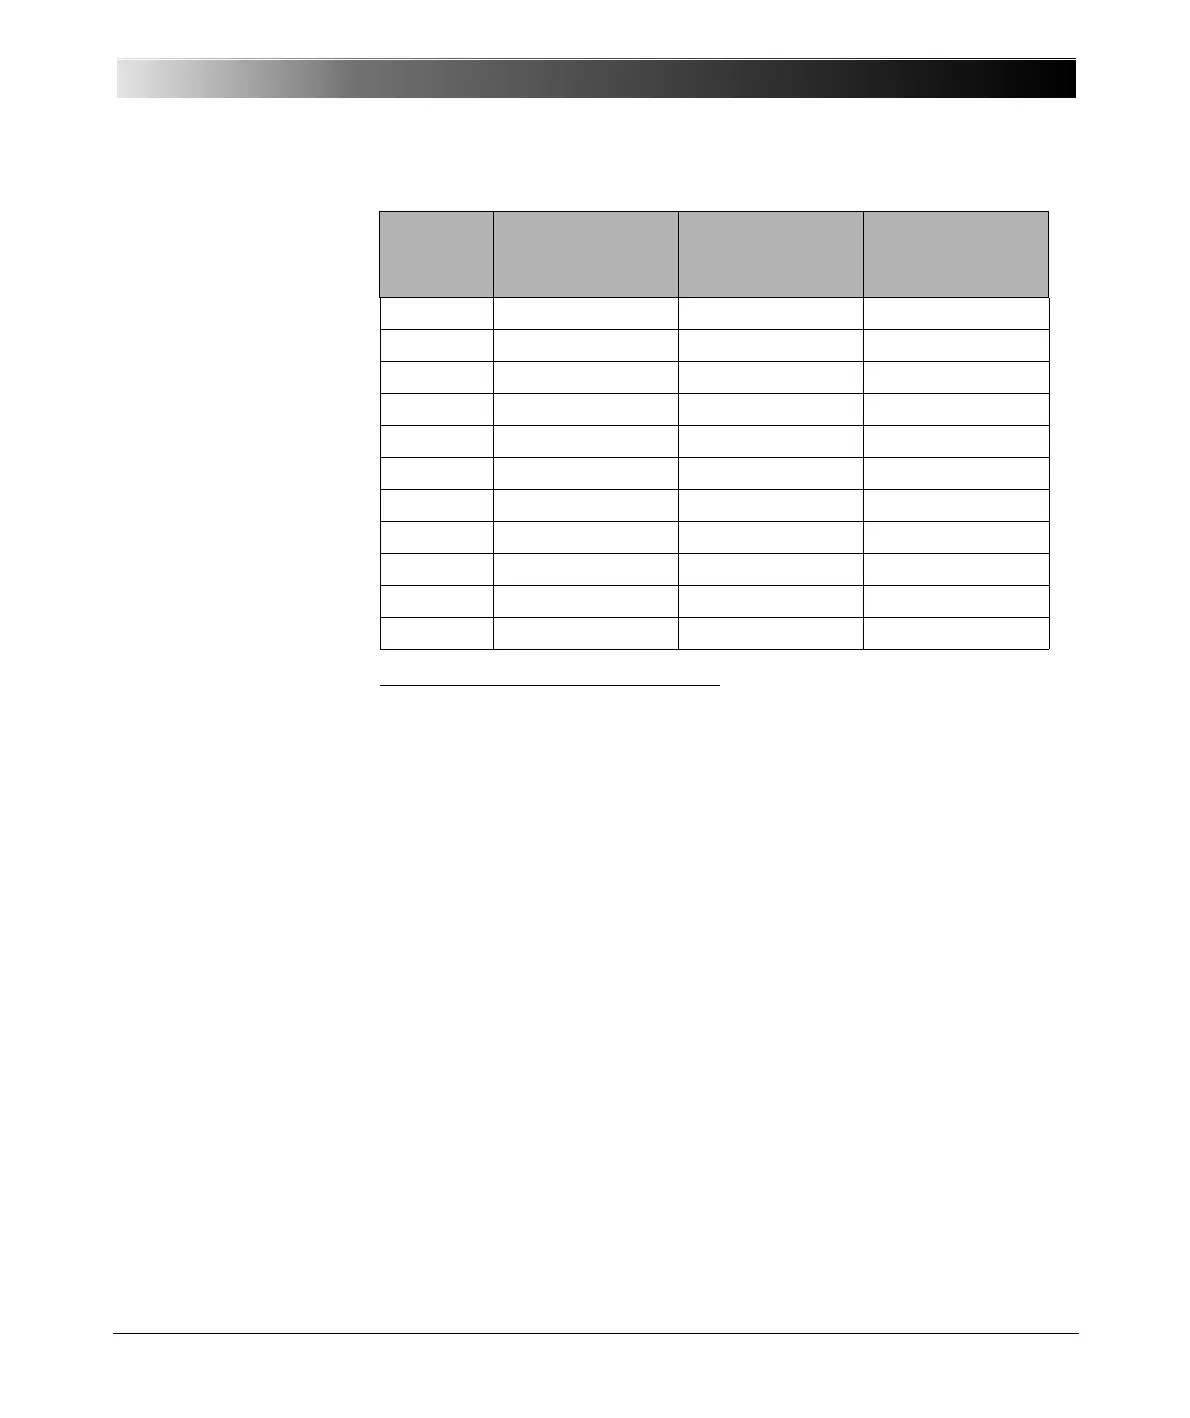
Table 6-53:
The maximum recording
time depends on the
number of active channels
and the sampling
frequency
Accuracy of the sampling value:
• measurement ranges 600 V, 100 V, 10 V, 1 V:
± 0.2 % typical
± 0.5 % guaranteed
• measurement range 100 mV:
± 0.3 % typical
± 0.6 % guaranteed
The accuracy data are full scale errors.
6.11.9 Trend Recording
In Trend Recording Mode, you can make a historical plot of various
measurements over time. It is possible to measure RMS voltage, RMS
current, phase, real, apparent and reactive power and the power factor.
The main view has a CTS Chart. Each selected measurement function
appears in a separate diagram (i.e. all frequency measurements in the
frequency diagram). RMS current and voltage appear in separate diagrams.
Time is displayed in seconds on the x-axis. The diagram is scrolled from
right-to-left as new data is recorded.
Number of
active
channels
Maximum
recording time [s]
at fs = 28.4 kHz
Maximum
recording time [s]
at fs = 9.48 kHz
Maximum
recording time [s]
at fs = 3.16 kHz
1 35.16 s 105.47 s 316.41 s
2 17.58 s 52.73 s 158.20 s
3 11.72 s 35.16 s 105.47 s
4 8.79 s 26.37 s 79.10 s
5 7.03 s 21.09 s 63.28 s
6 5.86 s 17.58 s 52.73 s
7 5.02 s 15.07 s 45.20 s
8 4.40 s 13.18 s 39.55 s
9 3.91s 11.72s 35.15s
10 3.52 s 10.55 s 31.64 s
11
1
1
All binary inputs are stored as one channel.
3.20 s 9.59 s 28.76 s