OPTIMOD-FM OPERATION
4-11
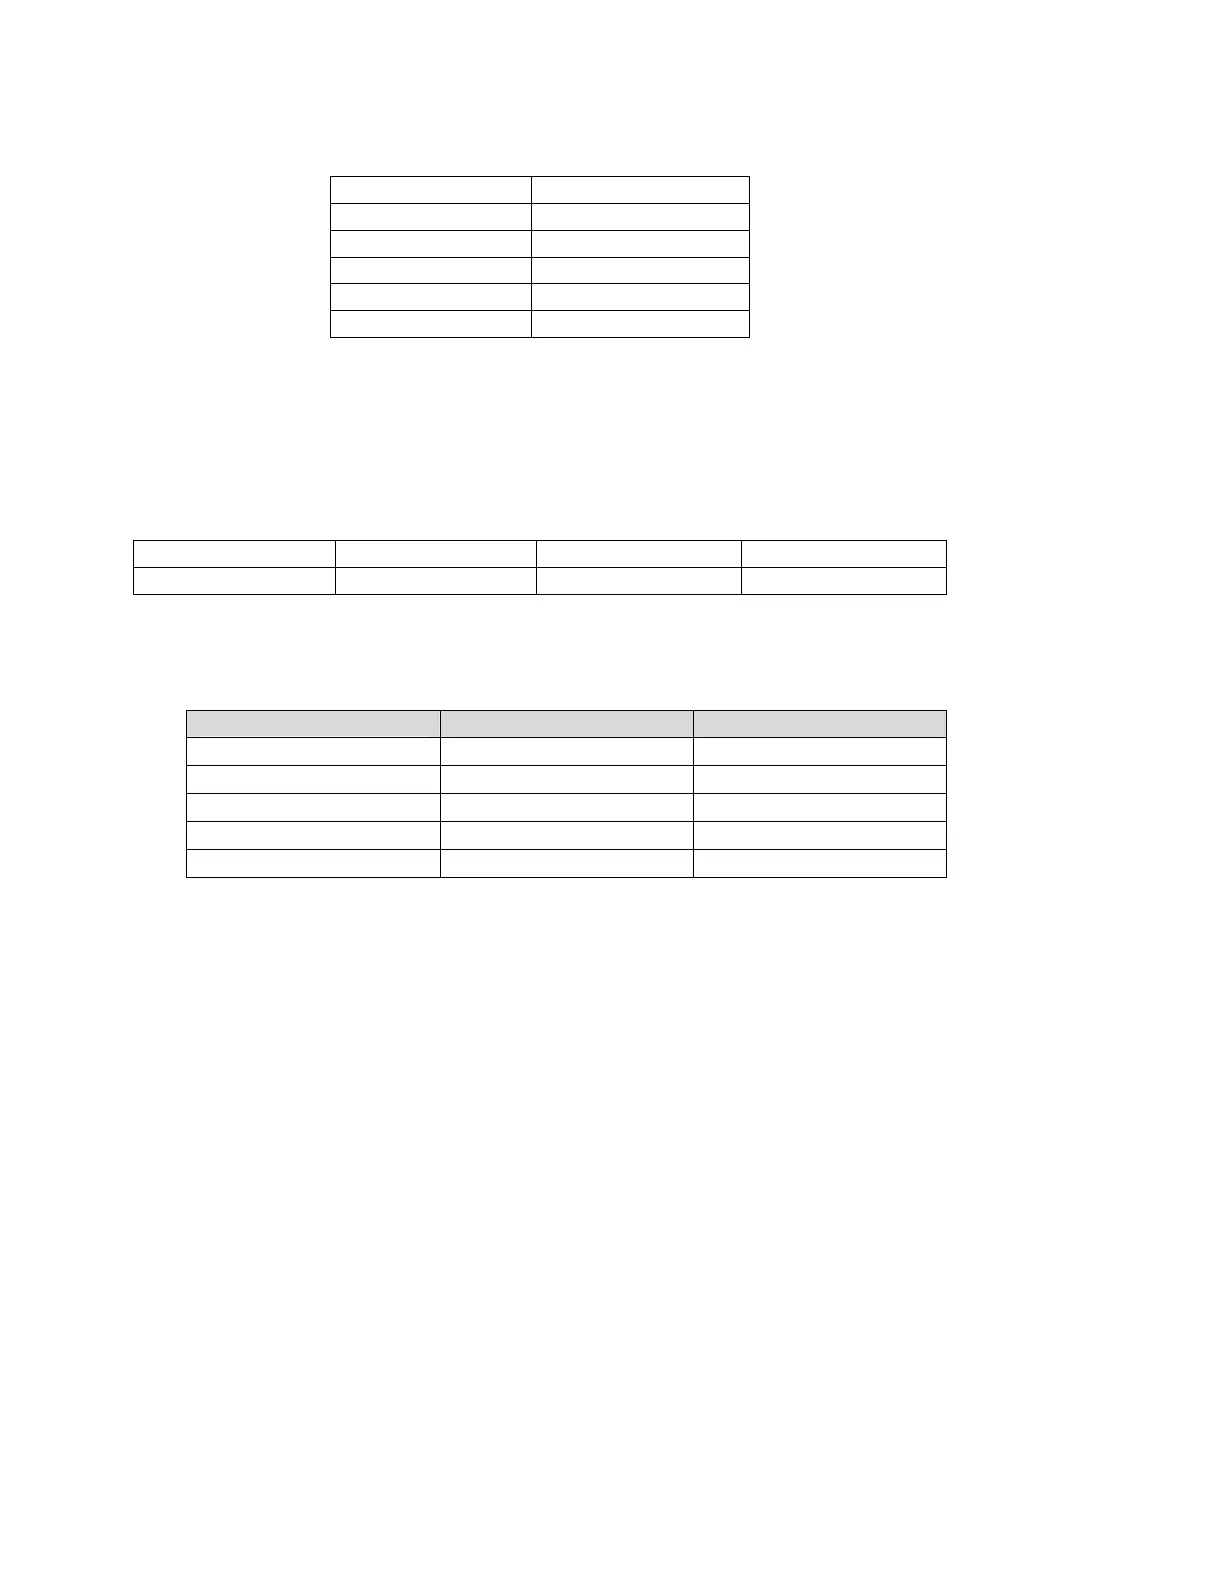
4 +5V Digital
5 +3.3V #1
6 +3.3V #2
7 +3.3V #3
8 +3.3V #4
9 +3.3V #5
Table 4-1: Decoder Chart for Power Supervisor
Measuring the power supply at the test points on the power supply regulator board is not
practical with the power supply installed because the heat sink makes the test points inac-
cessible. Therefore, it is best to take the measurements on the backplane at Molex con-
nector J7. When one faces the connector, the voltages can be found on the pins in the fol-
lowing pattern:
+5V –5V +15V –15V
+5V digital +12V unreg. Digital ground Analog ground
Table 4-2: Layout Diagram of J7, with expected voltages on each pin
C)
Measure the regulated voltages at J7 with the DVM and observe the ripple with an
oscilloscope, AC-coupled. The following results are typical:
Power Supply Rail
DC Voltage (volts) AC Ripple (mV p-p)
+15VDC
+15 ± 0.5
<20
–15VDC
–15 ± 0.5
<20
+5VDC
+5 ± 0.25
<20
–5VDC
–5 ± 0.25
<20
Digital +5VDC
+5 ± 0.25
[Obscured by noise]
Table 4-3: Typical Power Supply Voltages and AC Ripple
3. Check Analog Output Trim Levels.
A) Verify 8400 software controls are set to their default settings. (Refer to page 4-9.)
B) Feed the 8400 output with the built-in 400 Hz Test tone.
To turn on the
Test tone:
a) Navigate to System Setup.
b) Choose Test Modes.
c) Navigate to the Tone button and press Enter.
C) Connect the audio voltmeter to the Left Analog Output.
D) Adjust output trim VR200 to make the meter read +10.6 dBu. (0 dBu = 0.775V
rms.) Verify a frequency reading of 400 Hz.
E) Verify THD+N reading of <0.05% (0.02% typical) using a 22 kHz low pass filter
in the distortion analyzer.
 Loading...