66 . Spectrum Two N User's Guide
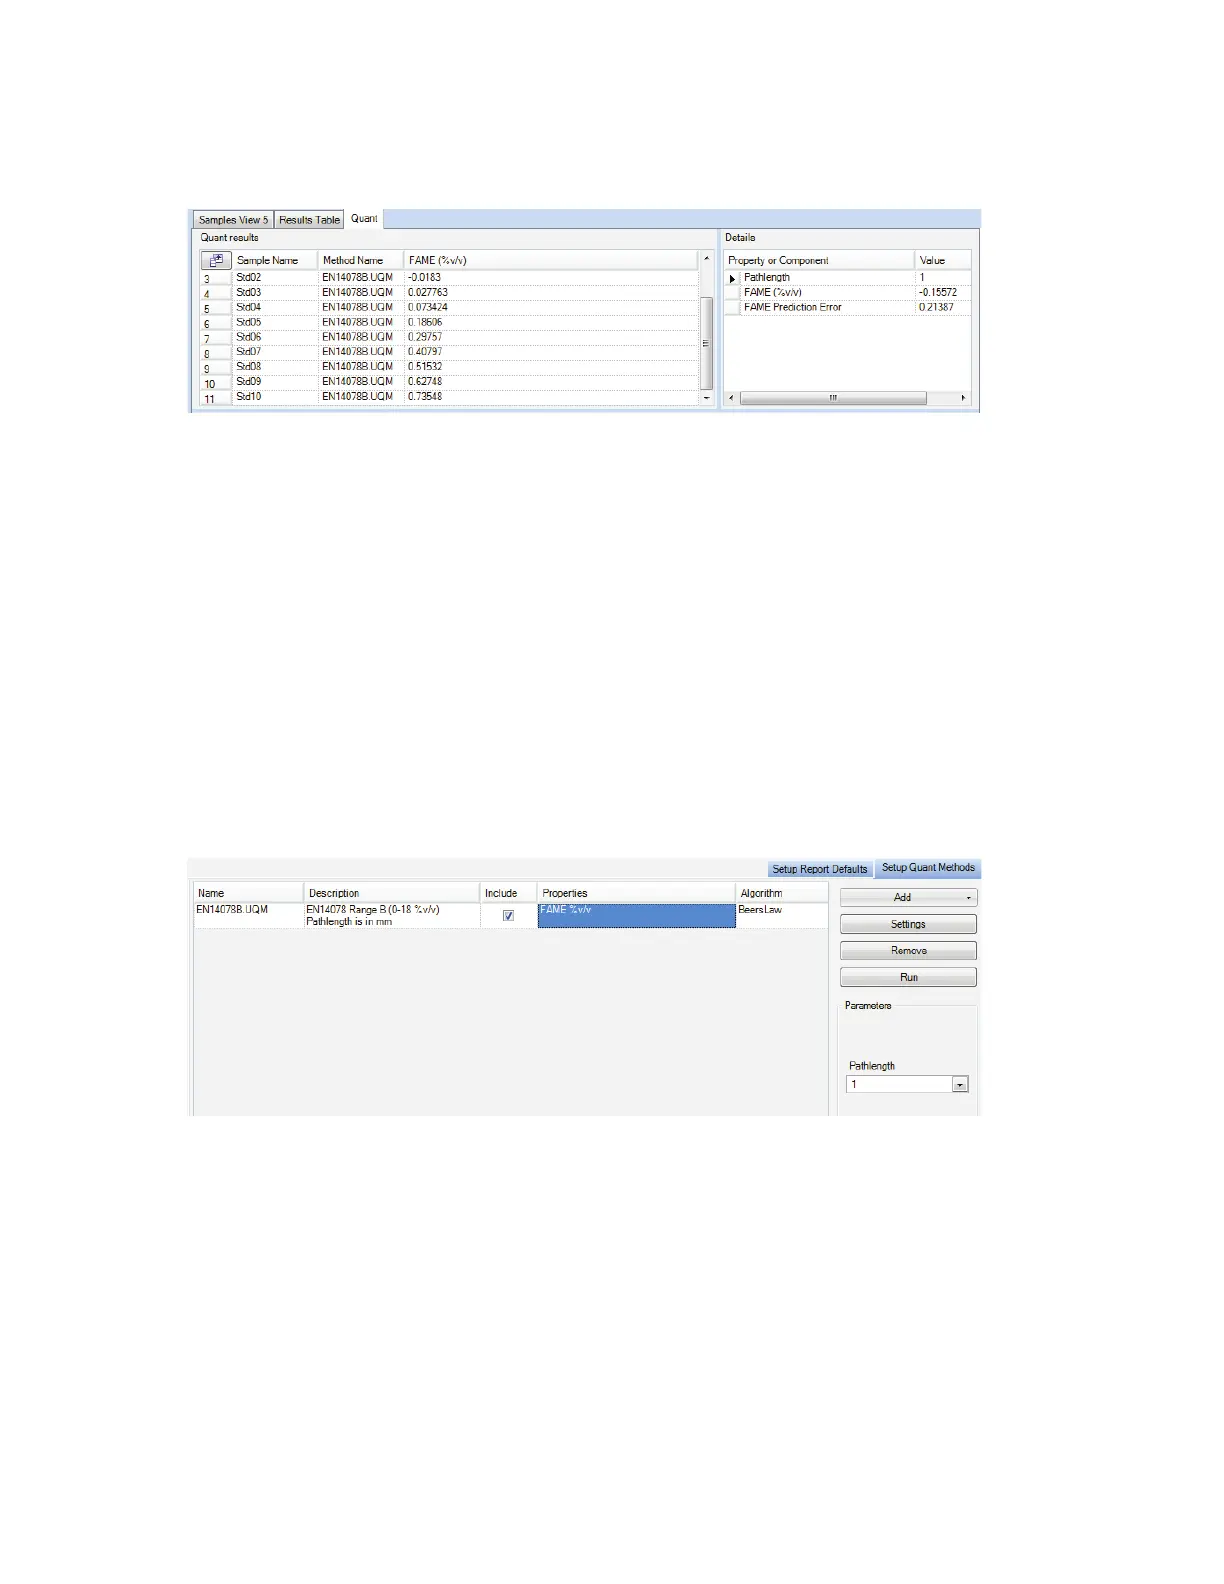
The results are displayed on the Quant tab in the Viewing Area (Figure 48), and in the
Results table. In this example, the Prediction Property calculated by the Beer’s Law algorithm
was FAME (fatty acid methyl ester) concentration in % v/v.
Figure 50 Quant tab
In the upper left quadrant your source spectrum or spectra are displayed, with the Quant
prediction results. For each source spectrum selected, more information is shown in the
Details section.
For each sample, the source spectrum and any spectra generated as part of the analysis are
displayed in the graph below the Quant results, in the lower left quadrant of the Search tab.
The Quant methods used in the Quant prediction are defined on the Setup Quant Methods
tab:
Select Quant from the Setup menu to display the Setup Quant tabs.
Select which Quant methods are available on the Setup Quant Methods tab (Figure 49), and
specify which of the available methods should be included in the Quant prediction. Only files
or folders with Include enabled will be used to process the spectra.
Figure 51 Setup Quant Methods tab
 Loading...