3.5.6 Performance monitor
The Performance Monitor screen allows you to monitor the performance of
NAS using the analyzed illustrations.
Support Table:
Logical Drive Physical Drive Port
Bandwidth
● ● ●
Cache Usage
●
Dirty Cache
●
Maximum Latency
● ● ●
Average Latency
● ● ●
Minimum Latency
● ● ●
IO request
● ● ●
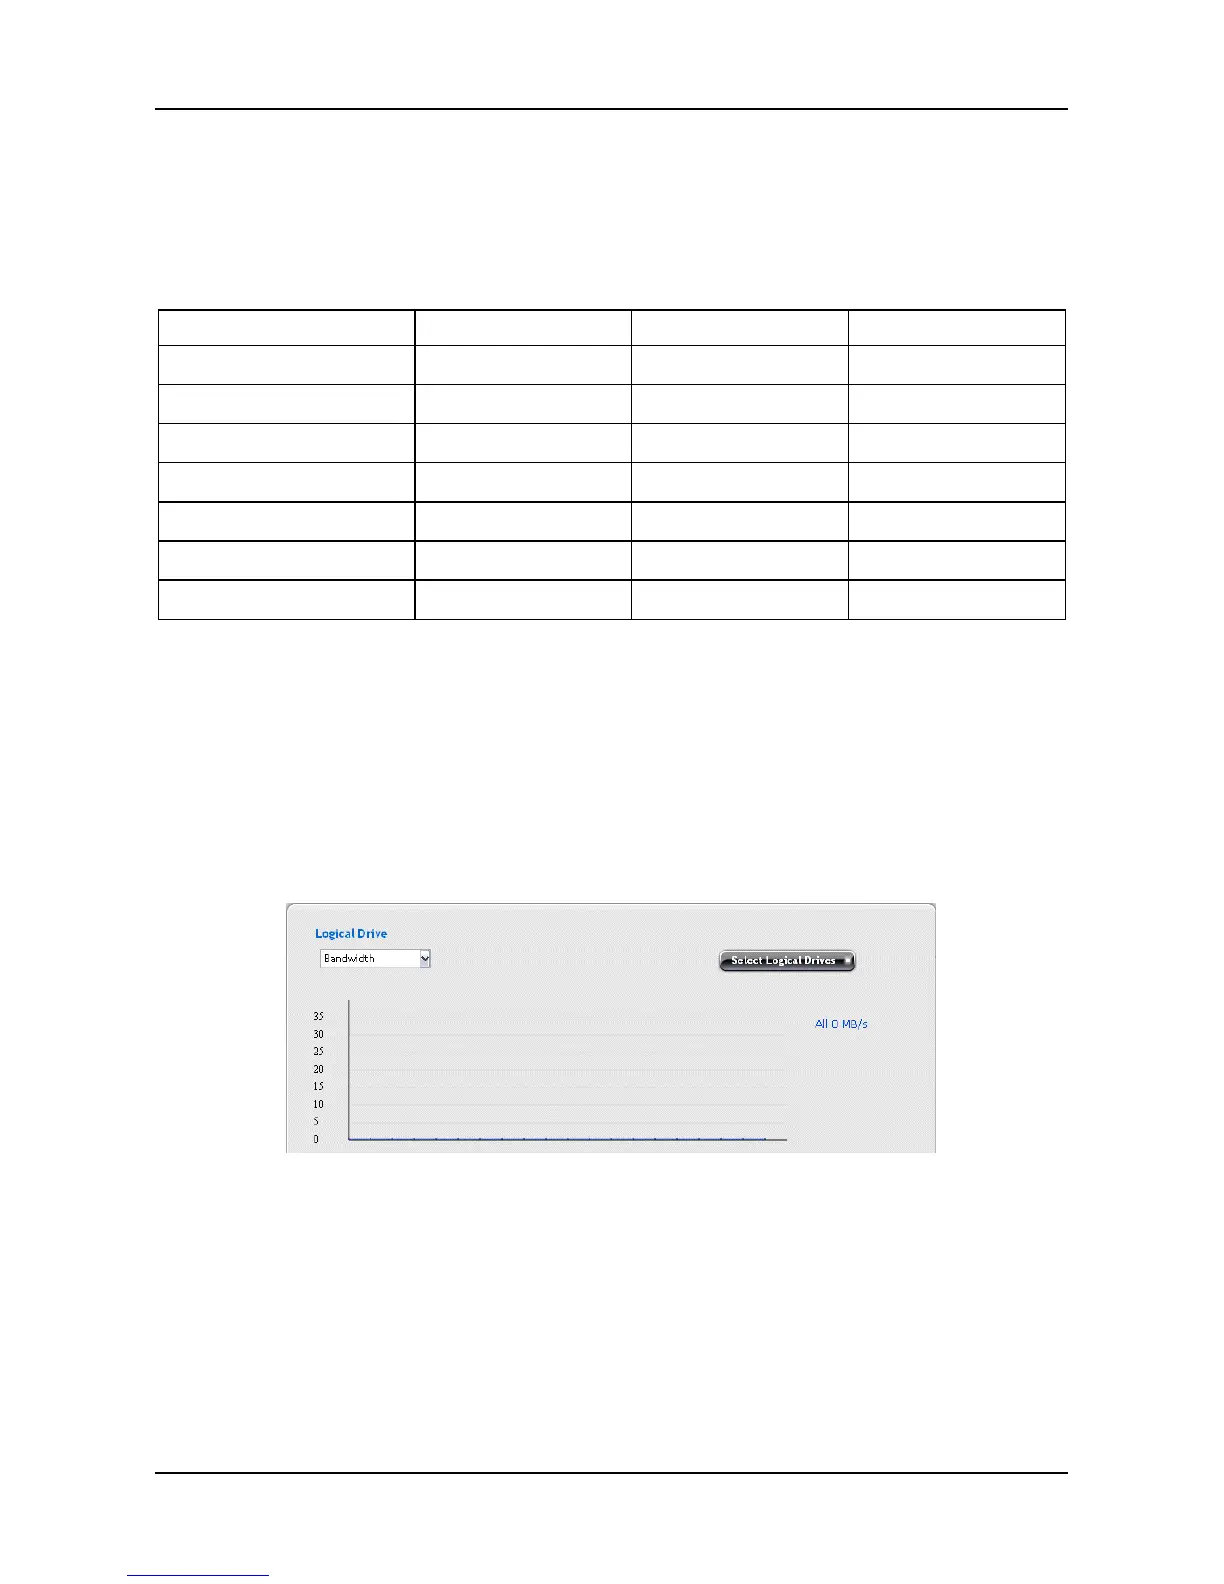
To view the Logical Drive performance:
1. Click AdminTool tab > Performance Monitor.
2. In the Logical Drive field, click the Select Logical Drives button to select
the logical drive you want and select a performance type from the
dropdown menu. When done, the performance of selected logical drive
will be shown in the illustration below.
To view the Physical Drive performance:
1. Click AdminTool tab > Performance Monitor.
2. In the Physical Drive field, click the Select Physical Drives button to
select the physical drive you want and select a performance type from
the dropdown menu. When done, the performance of selected physical
drive will be shown in the illustration below.
59
 Loading...