Page 20
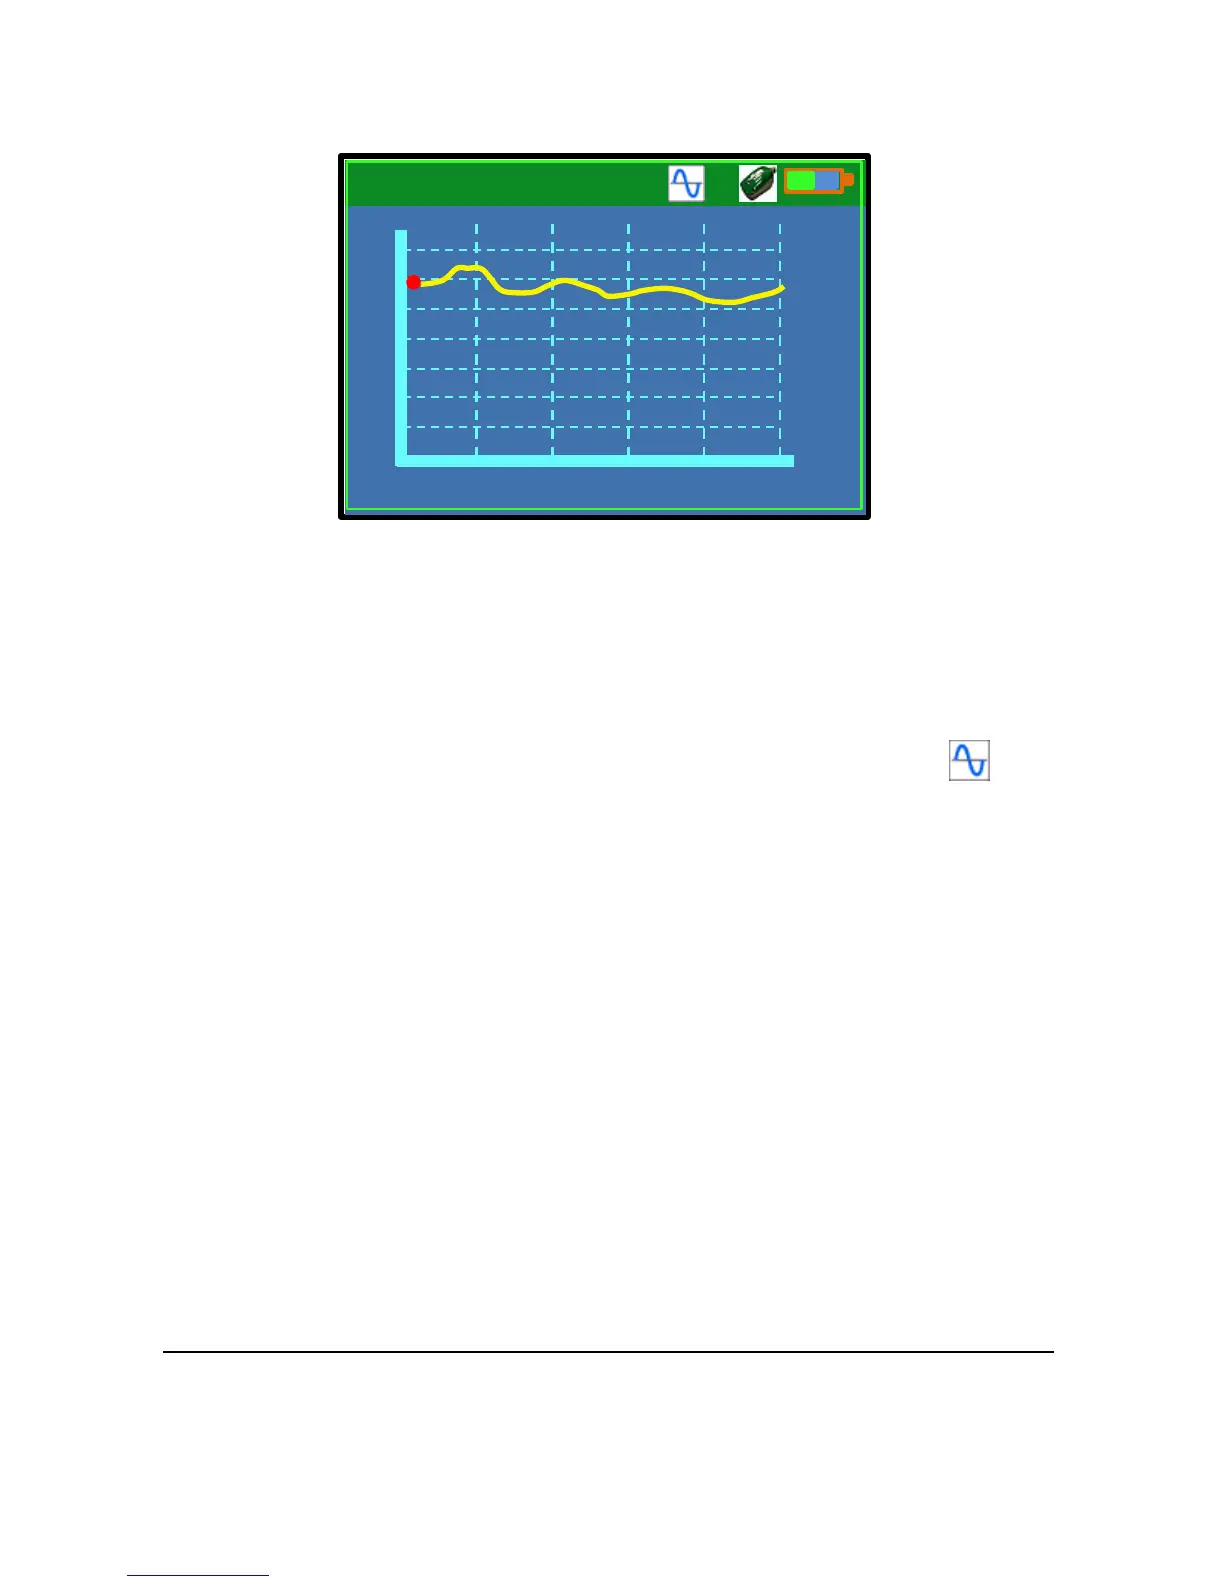
Diagnostic Trace Window
The Trace window displays the diagnostic trace from the Flow Pulse.
The red dot on the trace indicates the amount of flow perceived by the
sensor.
Use F1 key to enable or disable traces from the Flow Pulse. Trace
function is enabled by default upon connection. The trace icon will
appear to indicate when traces are being polled.
The trace function must be enabled before starting a data logging session to
ensure that diagnostic traces are saved onto file.