Page 30
During replay, the Flow Pulse will be powered-down to save power. The
replay icon is displayed in place of the sensor icon to indicate replay in
progress.
Connection to Flow Pulse will automatically resume upon completion or
cancellation of replay. During replay, press the F2 key at any time to
cancel.
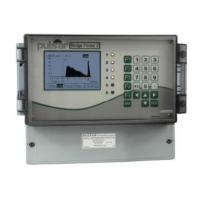
Charting Log Files
Charting the log files is a quick method of viewing the whole log file at
once. The charting function displays an entire length of “Record” at a time
before giving the option to either cancel the display or display the next
“Record” lengths worth of flow data.
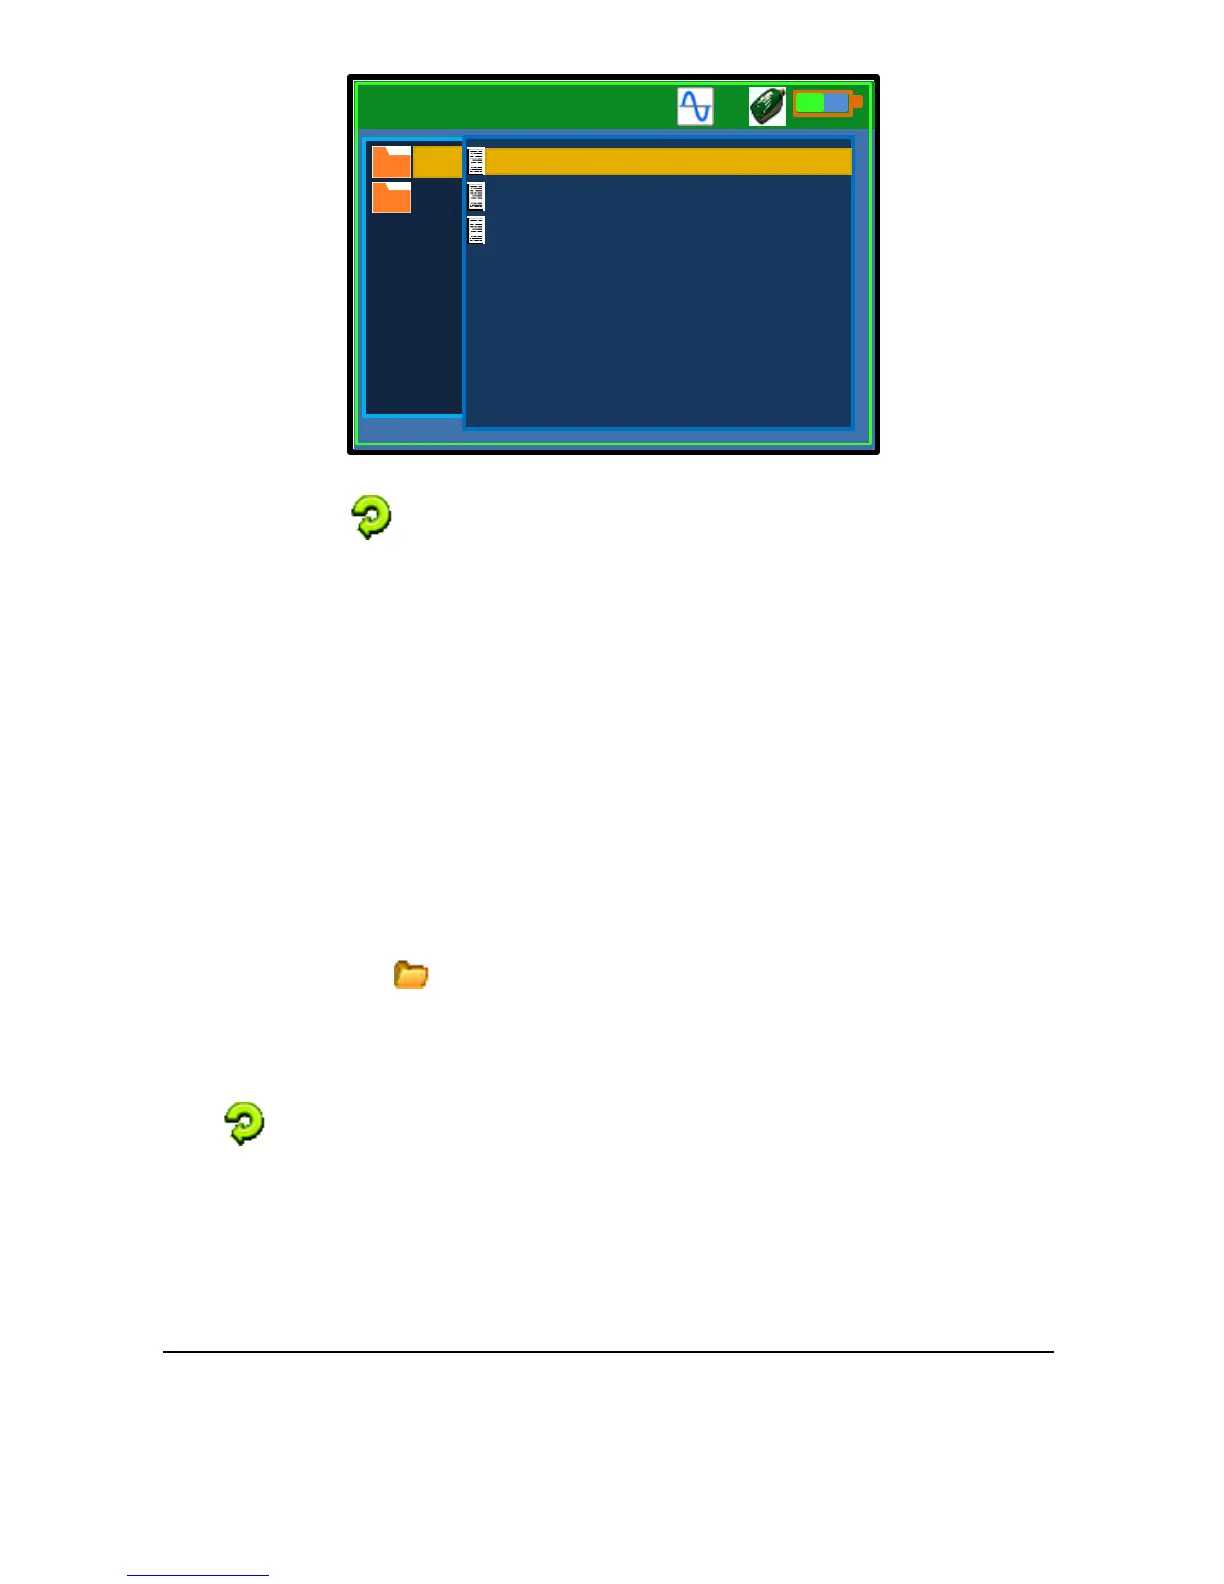
To display the chart of a log file using the controller, navigate to Settings-
2ToolsChart Data File. This will bring up a File Explorer window.
The folder icon indicates available data folders, which correspond to site
names that were set when data were logged. Select the folder to view a list
of available log files. Select a file to display.
During charting, the Flow Pulse will be powered-down. The replay icon
is displayed in place of the sensor icon to indicate charting in progress.
Connection to Flow Pulse will resume upon completion.
Due to the limited size of the chart in the Record window, up to 300 samples
will be charted before pausing.
To chart any remaining log in the file, press the F1 key. You may cancel the
charting process at any time by pressing the F2 key.