Measurement and Result Displays
R&S
®
FSWP
14User Manual 1177.5856.02 ─ 07
3 Measurement and Result Displays
Access: "Overview" > "Display Config"
Or: [MEAS] > "Display Config"
The I/Q Analyzer can capture I/Q data. The I/Q data that was captured by or imported
to the R&S FSWP can then be evaluated in various different result displays. Select the
result displays using the SmartGrid functions.
Up to 6 evaluations can be displayed in the I/Q Analyzer at any time, including several
graphical diagrams, marker tables or peak lists.
For details on working with the SmartGrid see the R&S FSWP Getting Started manual.
Note that the Spectrum Monitor only supports the "Spectrum" result display.
Measurements in the time and frequency domain
The I/Q Analyzer application (not Master in MSRA mode) can also perform measure-
ments on the captured I/Q data in the time and frequency domain (see also Chap-
ter 4.6, "I/Q Analyzer in MSRA Operating Mode", on page 34). They are configured
using the same settings and provide similar results. In addition, the analysis interval
used for the measurement is indicated as in all multistandard applications.
The time and frequency domain measurements and the available results are described
in detail in the R&S FSWP User Manual.
Result displays for I/Q data:
Magnitude .................................................................................................................... 14
Spectrum ......................................................................................................................15
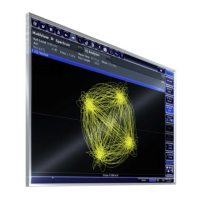
I/Q-Vector ..................................................................................................................... 16
Real/Imag (I/Q) .............................................................................................................16
Marker Table ................................................................................................................ 17
Marker Peak List .......................................................................................................... 18
Magnitude
Shows the level values in time domain.
 Loading...


