Measurement and Result Displays
R&S
®
FSWP
16User Manual 1177.5856.02 ─ 07
Remote command:
LAY:ADD:WIND? '1',RIGH,FREQ, see LAYout:ADD[:WINDow]? on page 140
Results:
TRACe<n>[:DATA]? on page 100
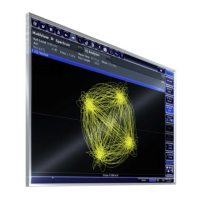
I/Q-Vector
Displays the captured samples in an I/Q-plot. The samples are connected by a line.
Note: For the I/Q vector result display, the number of I/Q samples to record ( "Record
Length" ) must be identical to the number of trace points to be displayed ("Sweep
Points"; for I/Q Analyzer: 10001). For record lengths outside the valid range of sweep
points the diagram does not show valid results.
Remote command:
LAY:ADD:WIND? '1',RIGH,VECT, see LAYout:ADD[:WINDow]? on page 140
Results:
TRACe<n>[:DATA]? on page 100
Real/Imag (I/Q)
Displays the I and Q values in separate diagrams.
 Loading...


