R&S
ZVL Getting Started
Reflection Measurements
Operating manual 1303.6538.62 - 05 48
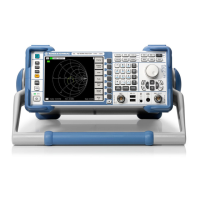
4. Still in the FORMAT menu, select Smith.
The Smith chart shows lines of constant real and imaginary part of the
impedance in the reflection coefficient plane.
Refer to section Display Formats and Diagram Types in Chapter 3 to
learn more about the diagram properties.
2.1.5 Saving and Printing Data
The analyzer provides standard functions for saving measurement settings and for
printing the results. You can use these functions as if you were working on a standard
PC. Moreover you can export your trace data to an ASCII file and reuse it in a later
session or in an external application.
Data transfer is made easier if external accessories are connected to the analyzer or if
the instrument is integrated into a LAN. Refer to sections External Accessories and
Remote Control in a LAN in Chapter 1 to obtain information about the necessary steps.
1. Press TRACE and activate More 1/3 – Import/Export Data – Export
Data.
2. In the Export Complex Data dialog opened, select a file location,
format and name and activate Save.
The active trace data is written to an ASCII file.
Refer to section Trace File Formats to learn more about trace files and
their use.
3. Press the PRINT key to the left of the display; then press Device
Setup.
4. In the Hardcopy Setup dialog opened, select Printer.
5. Close the dialog and press Print Screen to create a hardcopy of your
diagram.
 Loading...