BRP-Rotax
Operators Manual
ENGINE CALIBRATION
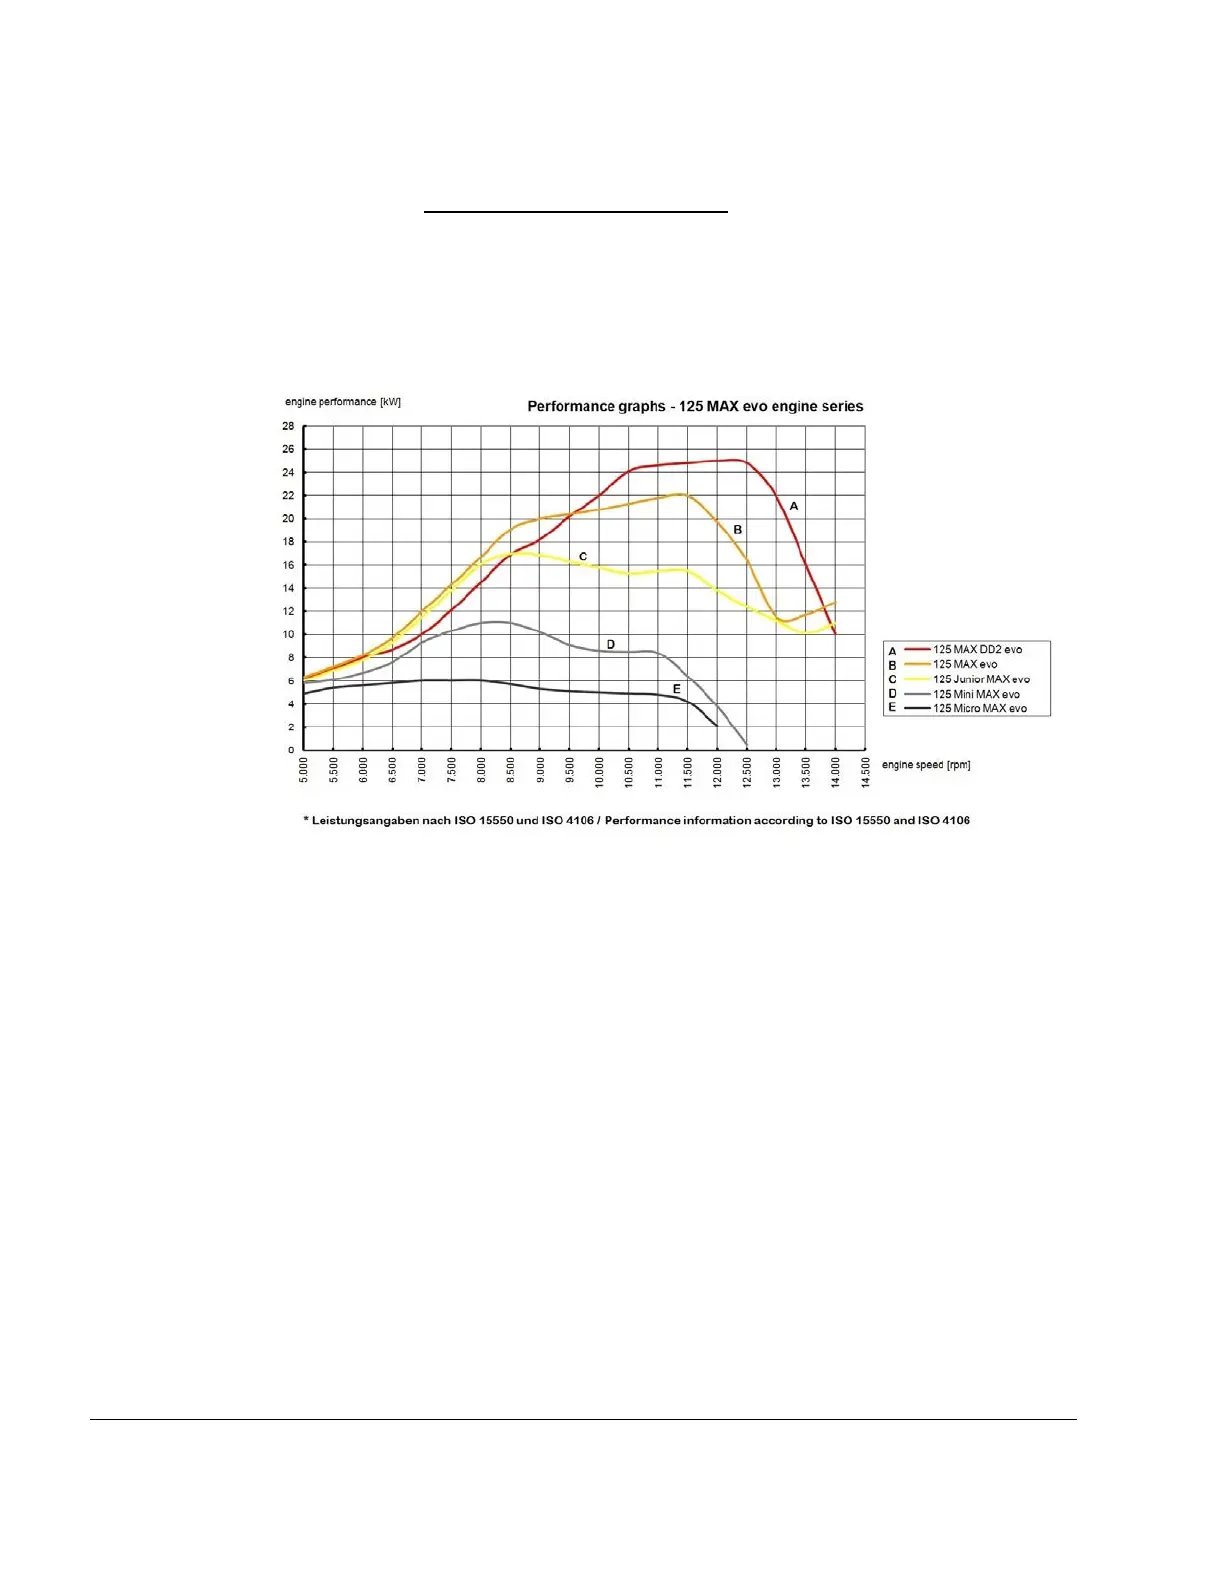
PERFORMANCE GRAPHS
In this diagram, the different performance characteristics of the MAX engines are shown.
The vertical Y-axis shows the power in kilowatts (kW). The horizontal X-axis shows the ro-
tational speed in revolutions per minute (rpm).
For more information, please check the performance data sheets on www.rotax-kart.com.
Figure 3.1: Performance graphs
______________________________________________________
3
Page 2
Edition: September 01 2019
Effectivity: 125 MAX DD2 evo

 Loading...