Revision: 3.0 Page 34 of 71
History
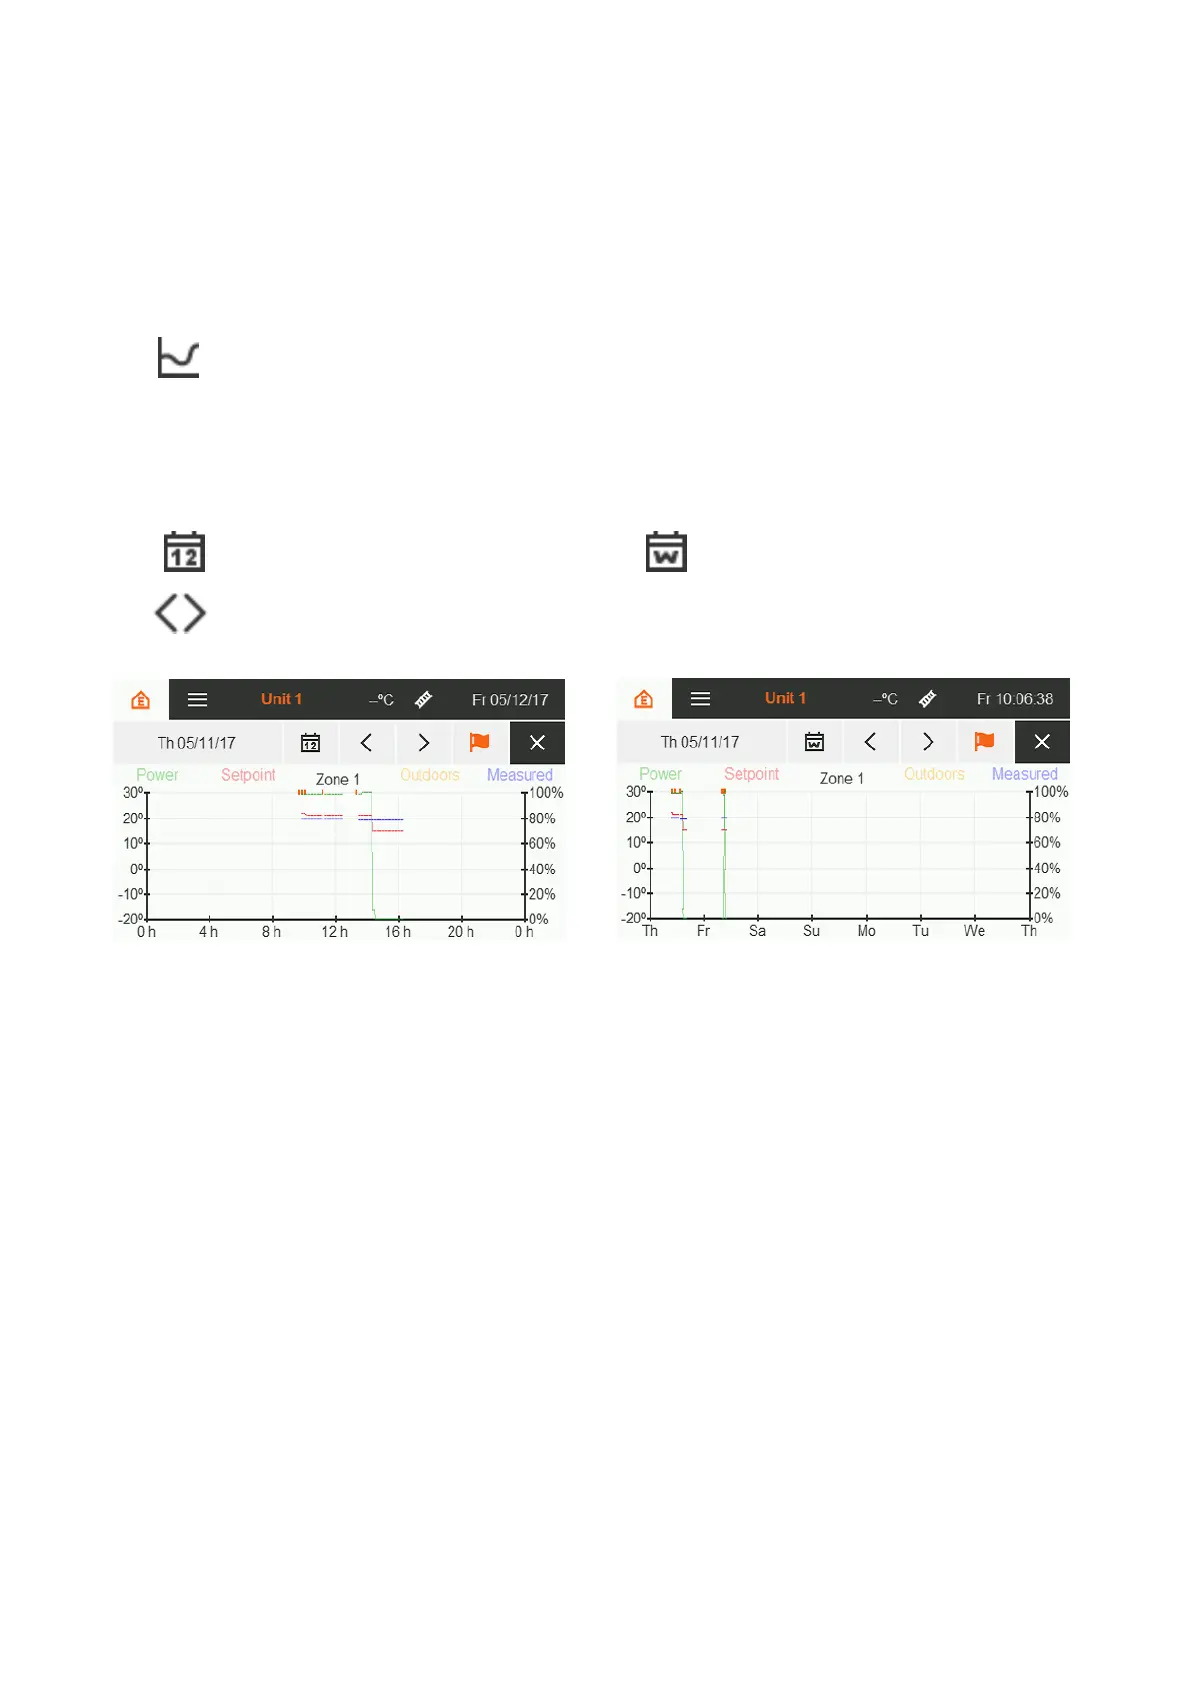
The history shows temperature curves and the corresponding heater output in selectable time periods. After
logging in as an expert, access to the history is possible via the zone details [see illustration].
History of the selected zones
The day view [see illustration] is shown first. The date displayed in the menu bar defines the day displayed.
Touch to manually set a desired day for viewing.
Touching the calendar icon allows you to switch between day and week view [see illustration]. In the week
view, the date displayed in the menu bar is the beginning of the week.
Scroll one day or one week forward or backward - depending on the active display
The time axis is divided into hours or days - depending on the active display. The following curves are shown:
Measured room temperature °C blue
Setpoint temperature °C red
Measured outdoor temperature °C yellow
Heater output % green
Figure 34: History day view
Figure 35: History week view