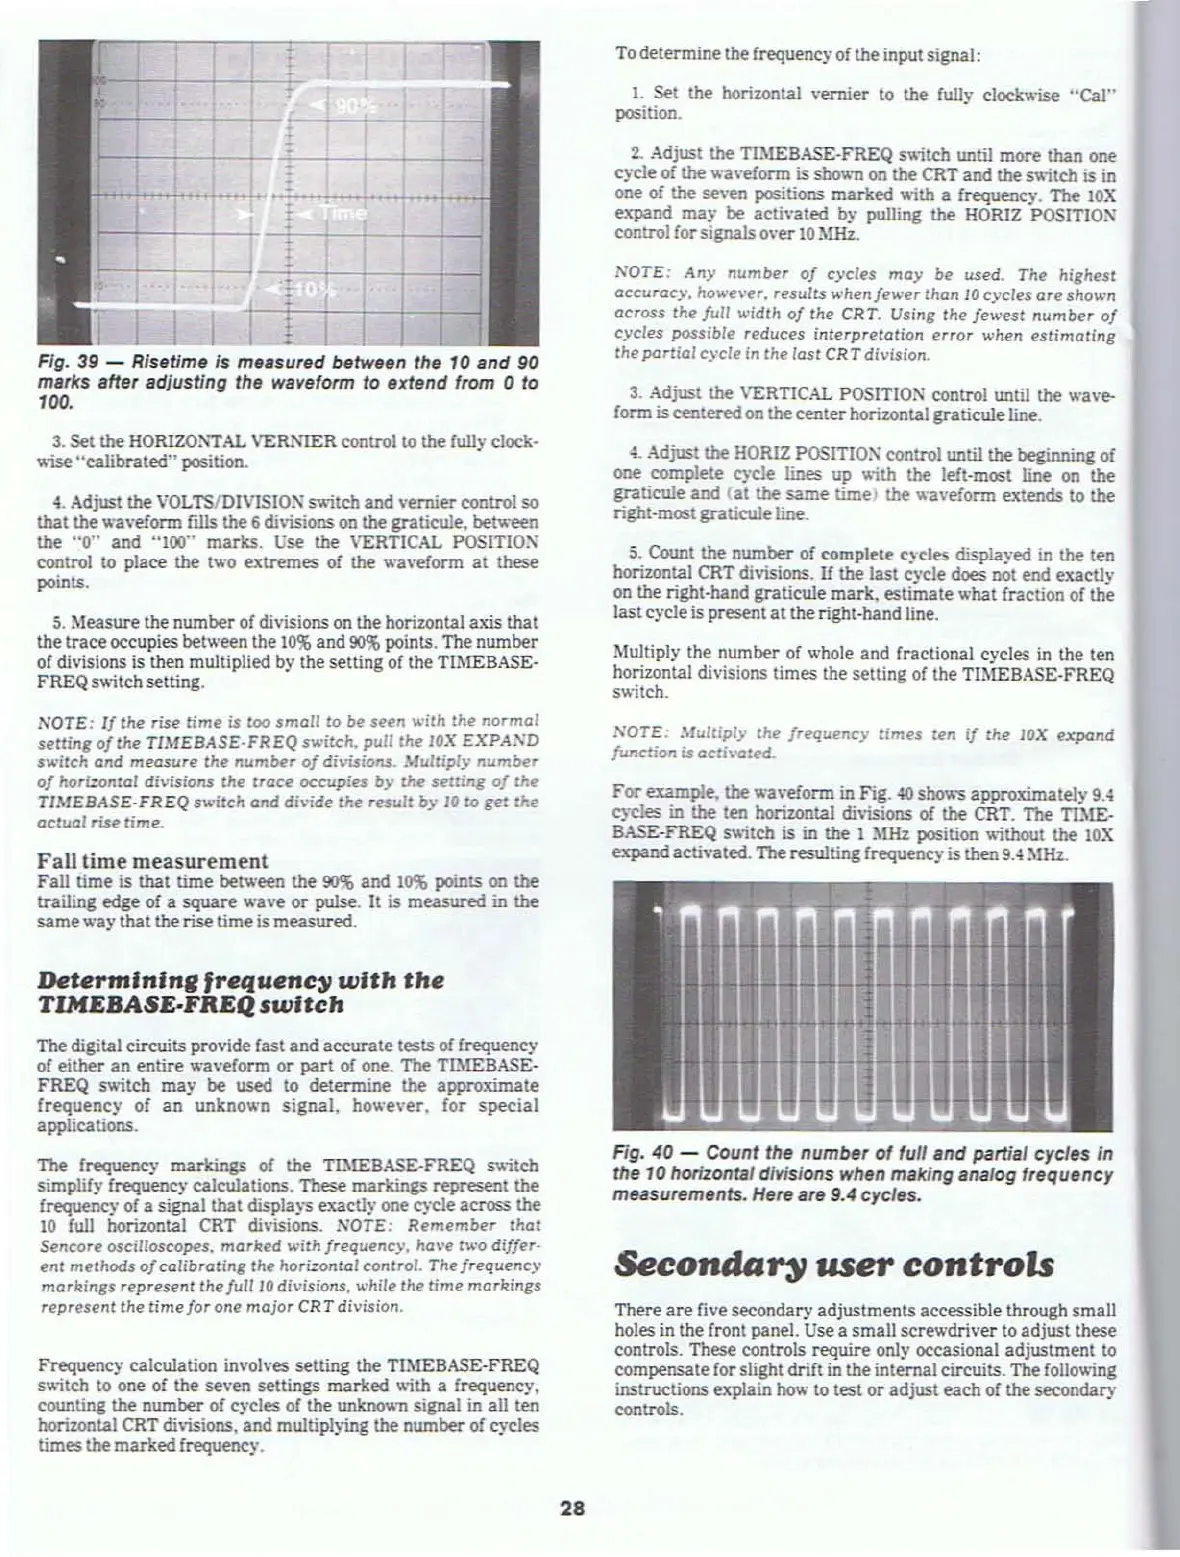
Fig. 39 - Risetime is measured between the 10 end
90
marks after adjusting tha waveform to extend from 0 to
100.
3.
Set the
HORIZO~lAL
\lERro-lER control to the fully clock·
'Aise
"calibrated" position.
4.
Adjust the VOLTSIDIVlSlOX sv.;tch and \'emier control so
that the
wa\'efonn fills the 6 divisions on the graticule. between
the
"0"
and "100"
marks.
Use the VERTICAL POSITIOX
control to place the two extremes of the wa\'eform
at
these
points.
5.
Measure the number of divisions
on
the horizontal axis that
the
trace
occupies between the
10$
and
90%
points. The number
of divisions is then multiplied by the setting
of
the TIMEBASE·
FREQs
....
itch
setting.
NOTE:
If
the
rise
time
is too
small
to be
seen
with the
normal
setting
of
the TIMEBASE·fR£Q
switch.
pull the
lOX
EXPAND
s
....
·itch and meaSUH' the
number
of
diviaioru. Multiply
number
of
horizontal
divisioru
the
trace
occupies
by
the
setting
of
the
TIMEBASE·FREQ
switch
and
divide
the
result
by
10
to
get
the
actual
rise
time.
Fall lime measurement
Fall time is that time between the
90%
and
10$
points on
the
trailing edge of a
square
wave
or
pulse.
It
is measured in the
same
waythat the rise timeis measured.
Determ'n'nll
'requenc:l'
with
the
TlMEBASE.FREQ
switch
The digital circuits provide fast and
accurate
tests
of
frequency
of either
an
entire waveform
or
part
of one. The
TL~tEBASE
FREQ switch
may
be used to determine the approximate
frequenc}' of
an
unkno
.....
n
signal.
however. for
special
applications.
The frequency markings of the TIMEBASE-FREQ s\\;tch
simplify frequency calculations. These markings represent the
frequency
of
a signal that displays
e.xac:U}·
one cycle across the
10
full horizontal CRT divisions. NOTE:
Remember
that
Sencore
oscilloscopes.
marked
with frequency.
have
t
....
·o
differ·
ent
methods
of
calibroting
rhe hori=ontal control.
The
frequency
mar.ltings represent the full
10
divisions, while the
time
markings
represent the
timefar
One
mojor
CRT
division.
Frequency calculation involves setting the TIMEBASE-FREQ
switch to one of the seven settings marked
\\ith a frequenc}·.
C'OWlting
the number of cycles of the unknown signal
in
all ten
horizontal CRT di\'isions. and multiplying the number
of
cycles
times the marked frequency.
28
Todeterminethe frequenc}' of the input signal:
1.
Set the horizontal vernier to the fully clockwise "ear
position.
2.
Adjust
the
Tl~tEBASE-FREQ
s\l.itch until more than one
cycle
of
the wa\'eform is sho
.....
n
on
the CRT and the sv.;tch is in
one of the se\'en positions
marked
....
ith
a frequency. The
lOX
expand ma}' be activated by pulling the HORIZ POSITION
control for signalsover
10
::\IHz.
NOTE:
Any
number
of
cycles
may
be used. The
highest
accuracy. ho
.....
e\·er.
results
when
fewer
than
10
cycles
are
shown
acrO.$S
the
full width
of
the CRT. Using the
lewest
number
of
cycles
possible
reduces
interpretation
error
when
estimating
the partial
cycle
In
the last CRTdivision.
3.
Adjust the VERTICAL POSITION control until the wave-
form is centeredon the center horizontal graticule line.
4.
Adjust
the
HORIZ
POSITIO:"l'
control until the beginning of
one complete cycle lines up
....
ith
the left-most line
on
the
graticule and
(at
the same time) the wavefonn extends to the
right-most
graticuleline.
5.
Count the number of complete
c~c1~
displa~-ed
in the ten
horizontal CRT divisions.
If
the last cycle does not end exacU}'
on the right·hand graticule
mark.
estimate
what fraction of the
last
cycleis present
at
the right·hand line.
Multiply the number of whole and fractional cycles in the ten
horizontal divisions times the setting of the TlMEBASE·FREQ
s
....
itch.
SOTE:
Multiply
the
frequency
times
ten
if
the
lOX
expand
function is
activated.
For
example. the
.....
aveform
in
Fig.
40
sho
.....
s approximately
9A
cycles
in
the
ten horizontal di\'isions of
the
CRT. The
TIM.£..
BASE-FREQ sv.itch is
in
the I
MHz
position \l.ithout the
lOX
expand
acti\·aterl. The resulting frequency is then
9A
MHz.
Fig. 40 - Count the number
of
full end partial cycles in
the
10 horizontal divisions when making enalog frequency
measurements. Here ere
9.4
eyetes.
Seconda~
user
controls
There
are
five secondary adjustments accessible through small
holes
in
the front panel. Use a small screwdriver to adjust these
controls. These controls
require only occasional adjustment
to
compensate for slight drift
in
theinternal circuits. The follo
....
ing
instructions explain how to test
or
adjust each
of
the secondat}·
controls.